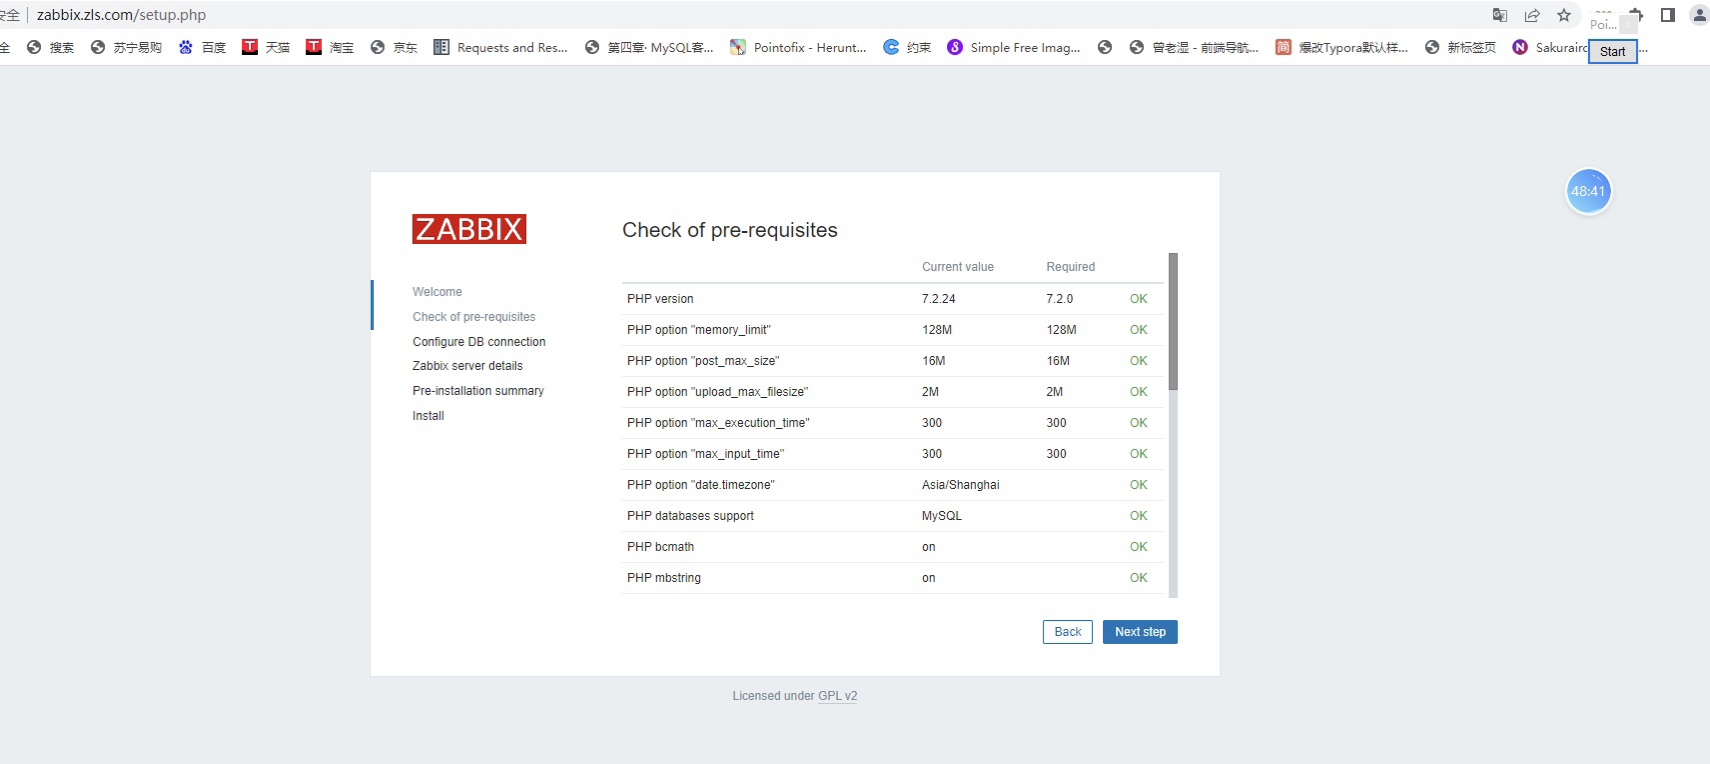
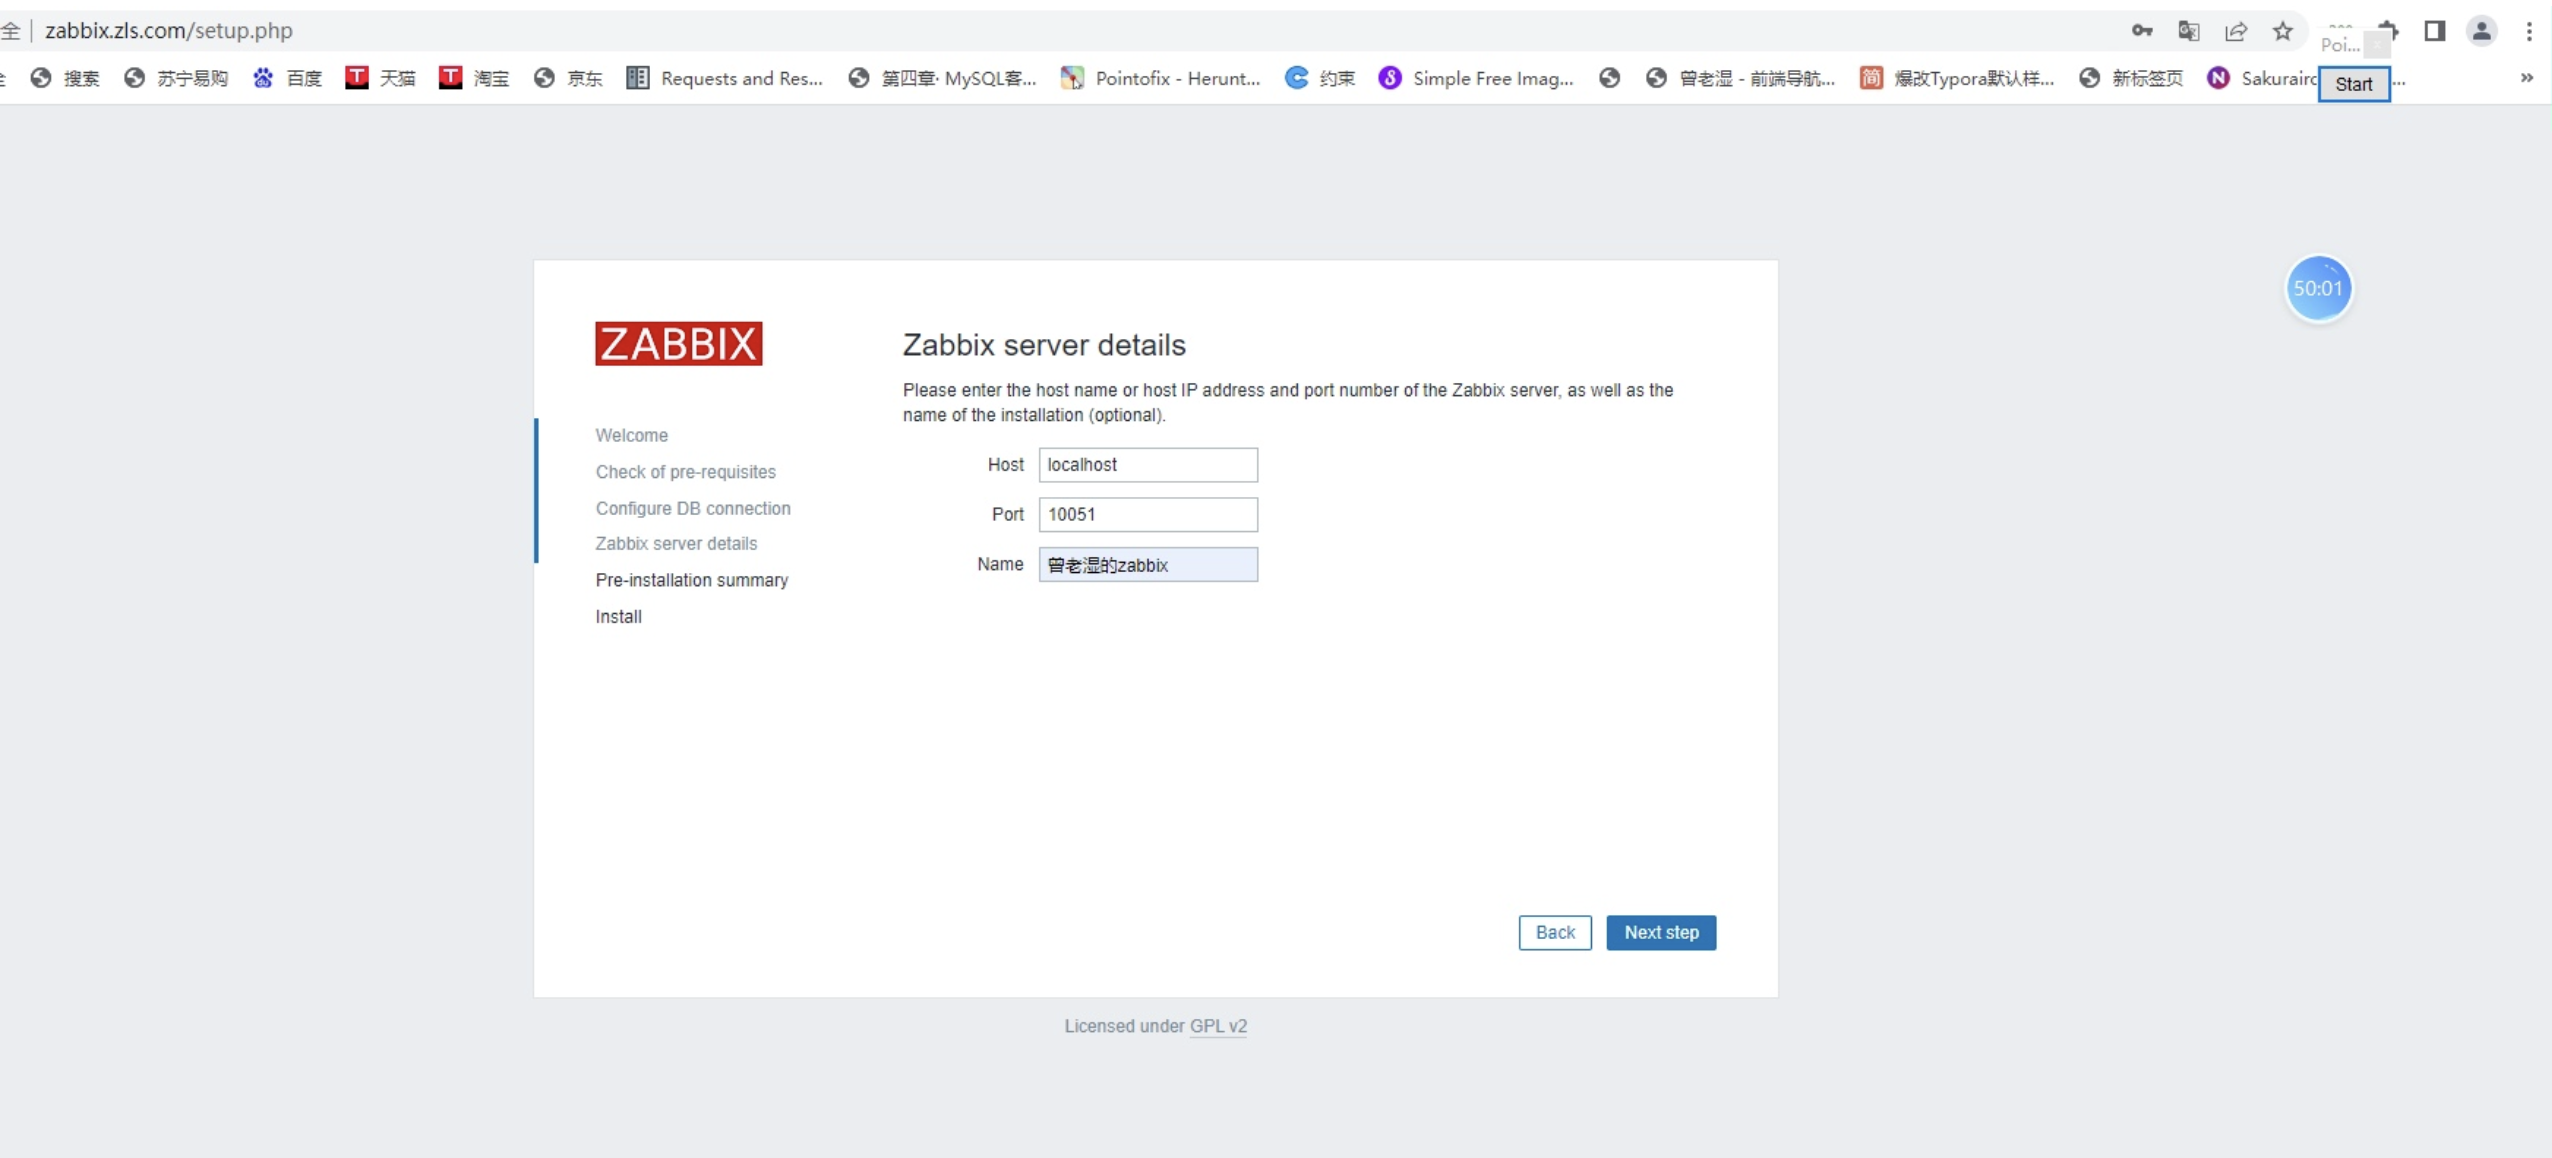
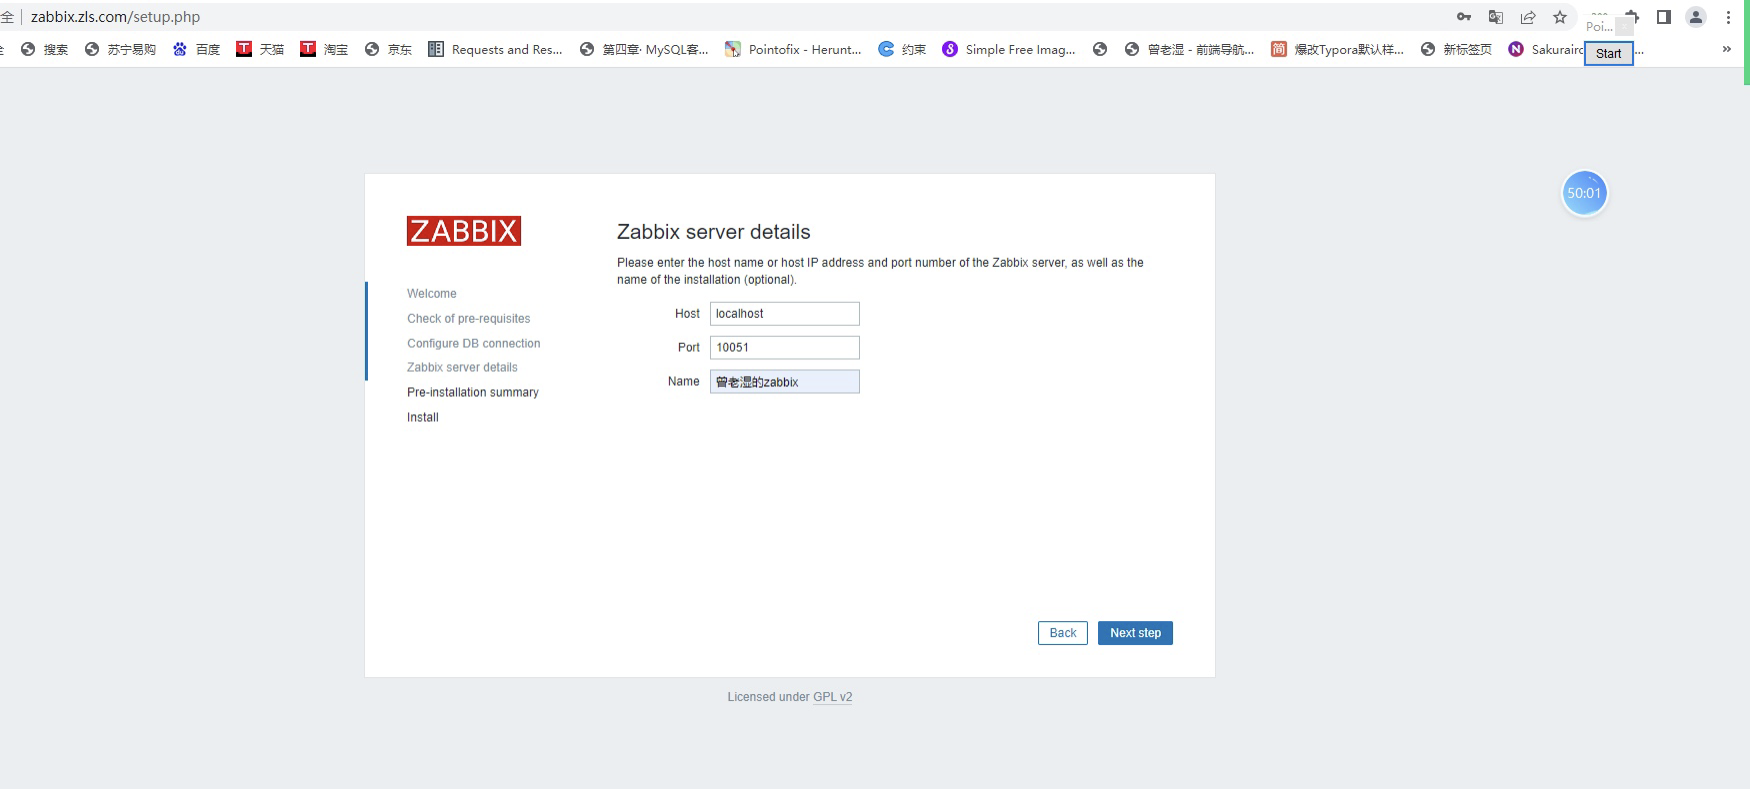
Zabbix基础入门 zabbix 快速入门安装 C/S架构的服务
服务端 :zabbix-server客户端 :zabbix-agent
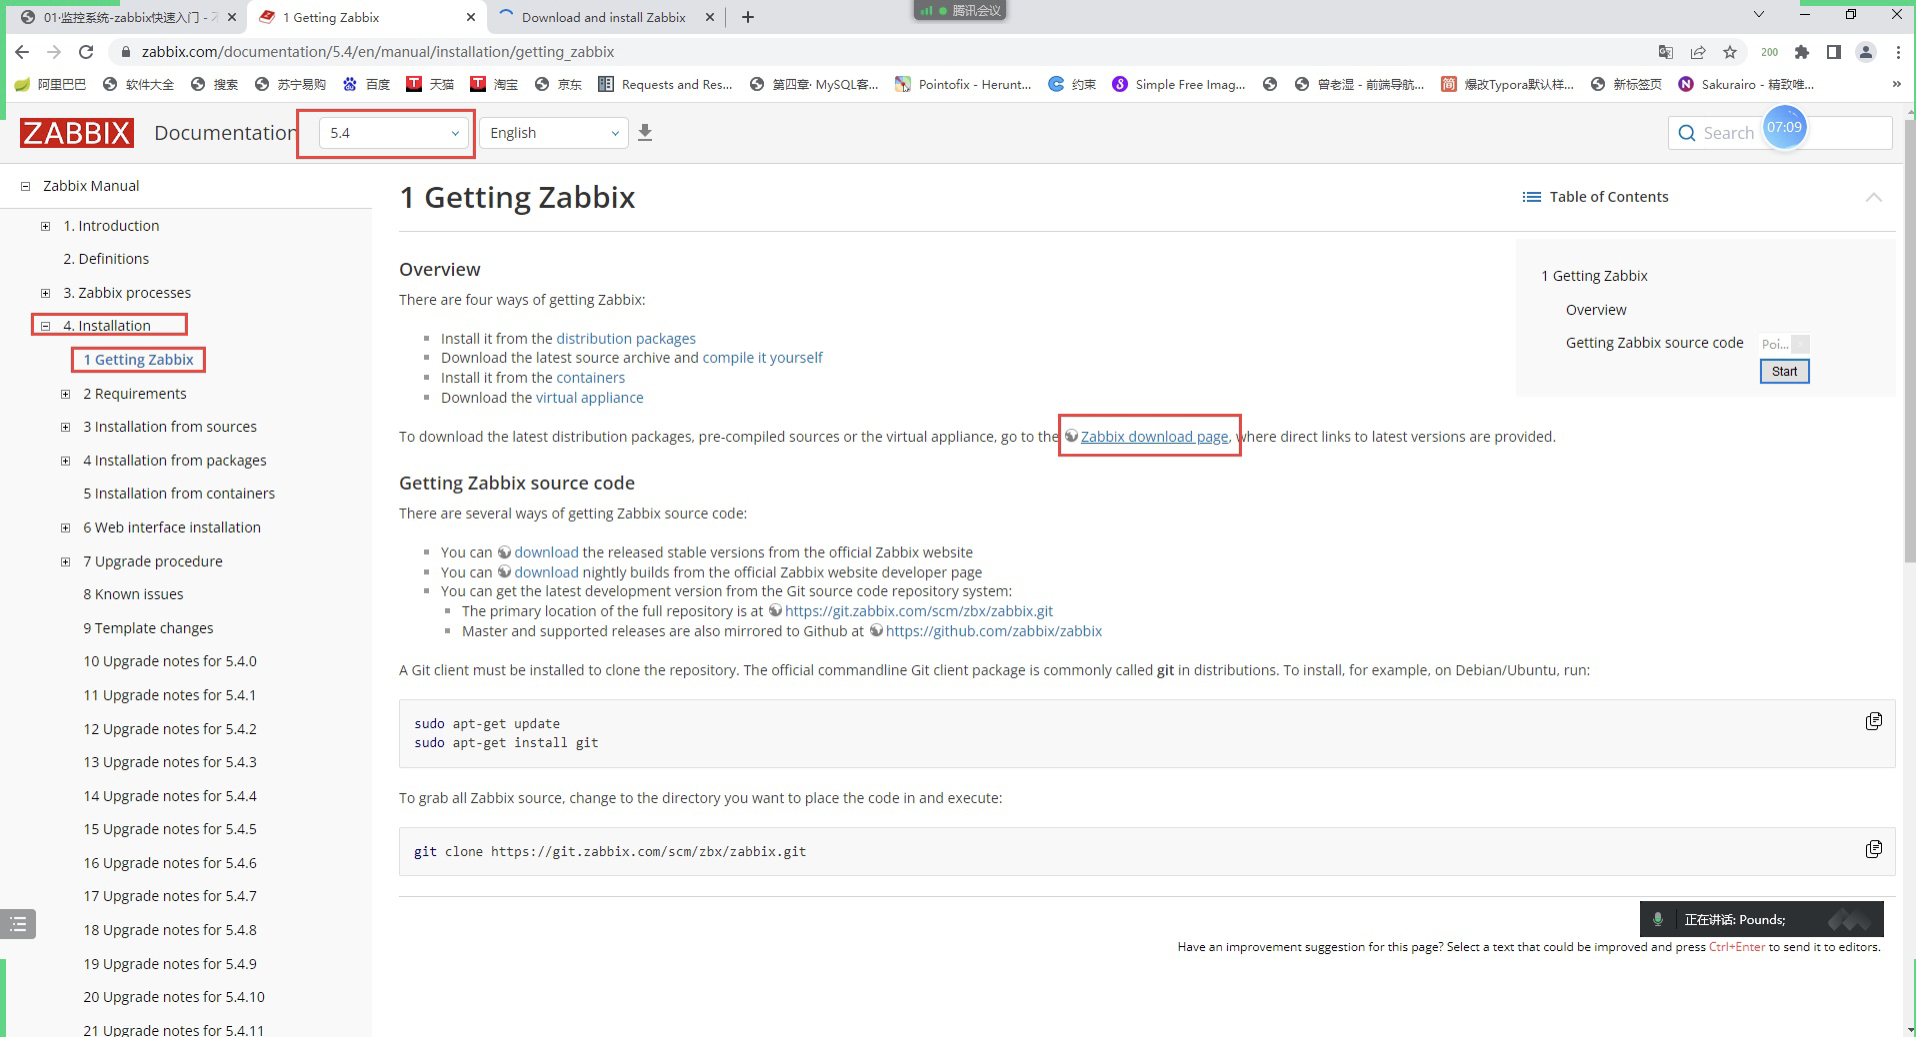
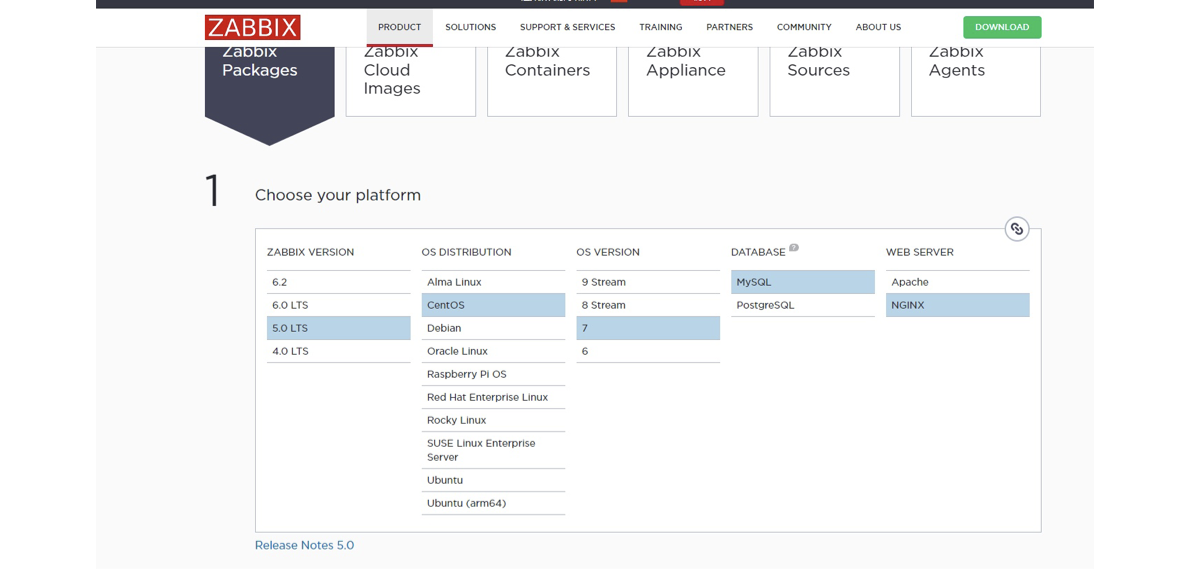
zabbix官网: https://www.zabbix.com/
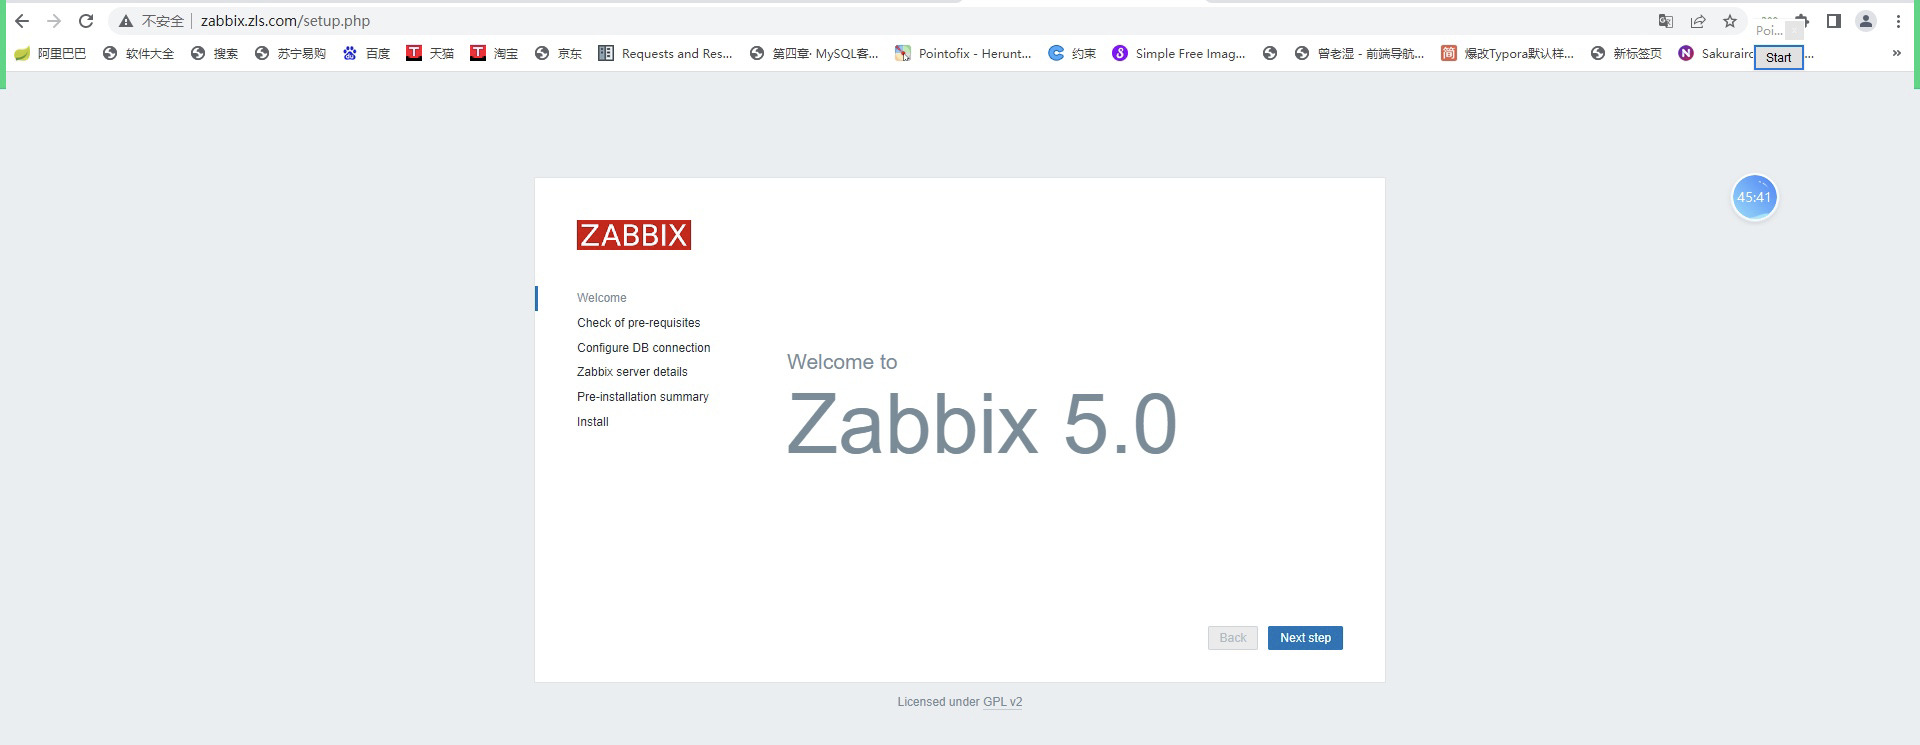
1 2 3 4 5 6 7 8 9 10 11 12 13 14 15 16 17 18 19 20 21 22 23 24 25 26 27 28 29 30 31 32 33 34 35 36 37 38 39 40 41 42 43 44 45 46 47 48 49 50 51 52 53 54 55 56 57 58 59 60 61 62 63 64 65 66 67 68 69 70 71 72 73 [root@m01 ~] [root@m01 ~] [root@m01 ~] [root@m01 ~] [zabbix-frontend] name=Zabbix Official Repository frontend - $basearch baseurl=http://repo.zabbix.com/zabbix/5.0/rhel/7/$basearch /frontend enabled=0 // 改为 1 gpgcheck=1 gpgkey=file:///etc/pki/rpm-gpg/RPM-GPG-KEY-ZABBIX-A14FE591 [root@m01 ~] mysql> create database zabbix character set utf8 collate utf8_bin; mysql> grant all on zabbix.* to zabbix@'172.16.1.%' identified by '123' ; [root@m01 ~] [root@db01 ~] [root@m01 ~] DBHost=172.16.1.53 DBUser=zabbix DBName=zabbix DBPassword=123 [root@m01 ~] server { listen 80; server_name zabbix.zls.com; ... } [root@m01 ~] [zabbix] user = nginx group = nginx listen.acl_users = nginx php_value[date.timezone] = Asia/Shanghai [root@m01 ~] [root@m01 ~] [root@m01 ~] tcp 0 0 0.0.0.0:10050 0.0.0.0:* LISTEN 102137/zabbix_agent tcp6 0 0 :::10050 :::* LISTEN 102137/zabbix_agent [root@m01 ~] tcp 0 0 0.0.0.0:10051 0.0.0.0:* LISTEN 102333/zabbix_serve tcp6 0 0 :::10051 :::* LISTEN 102333/zabbix_serve [root@m01 ~]
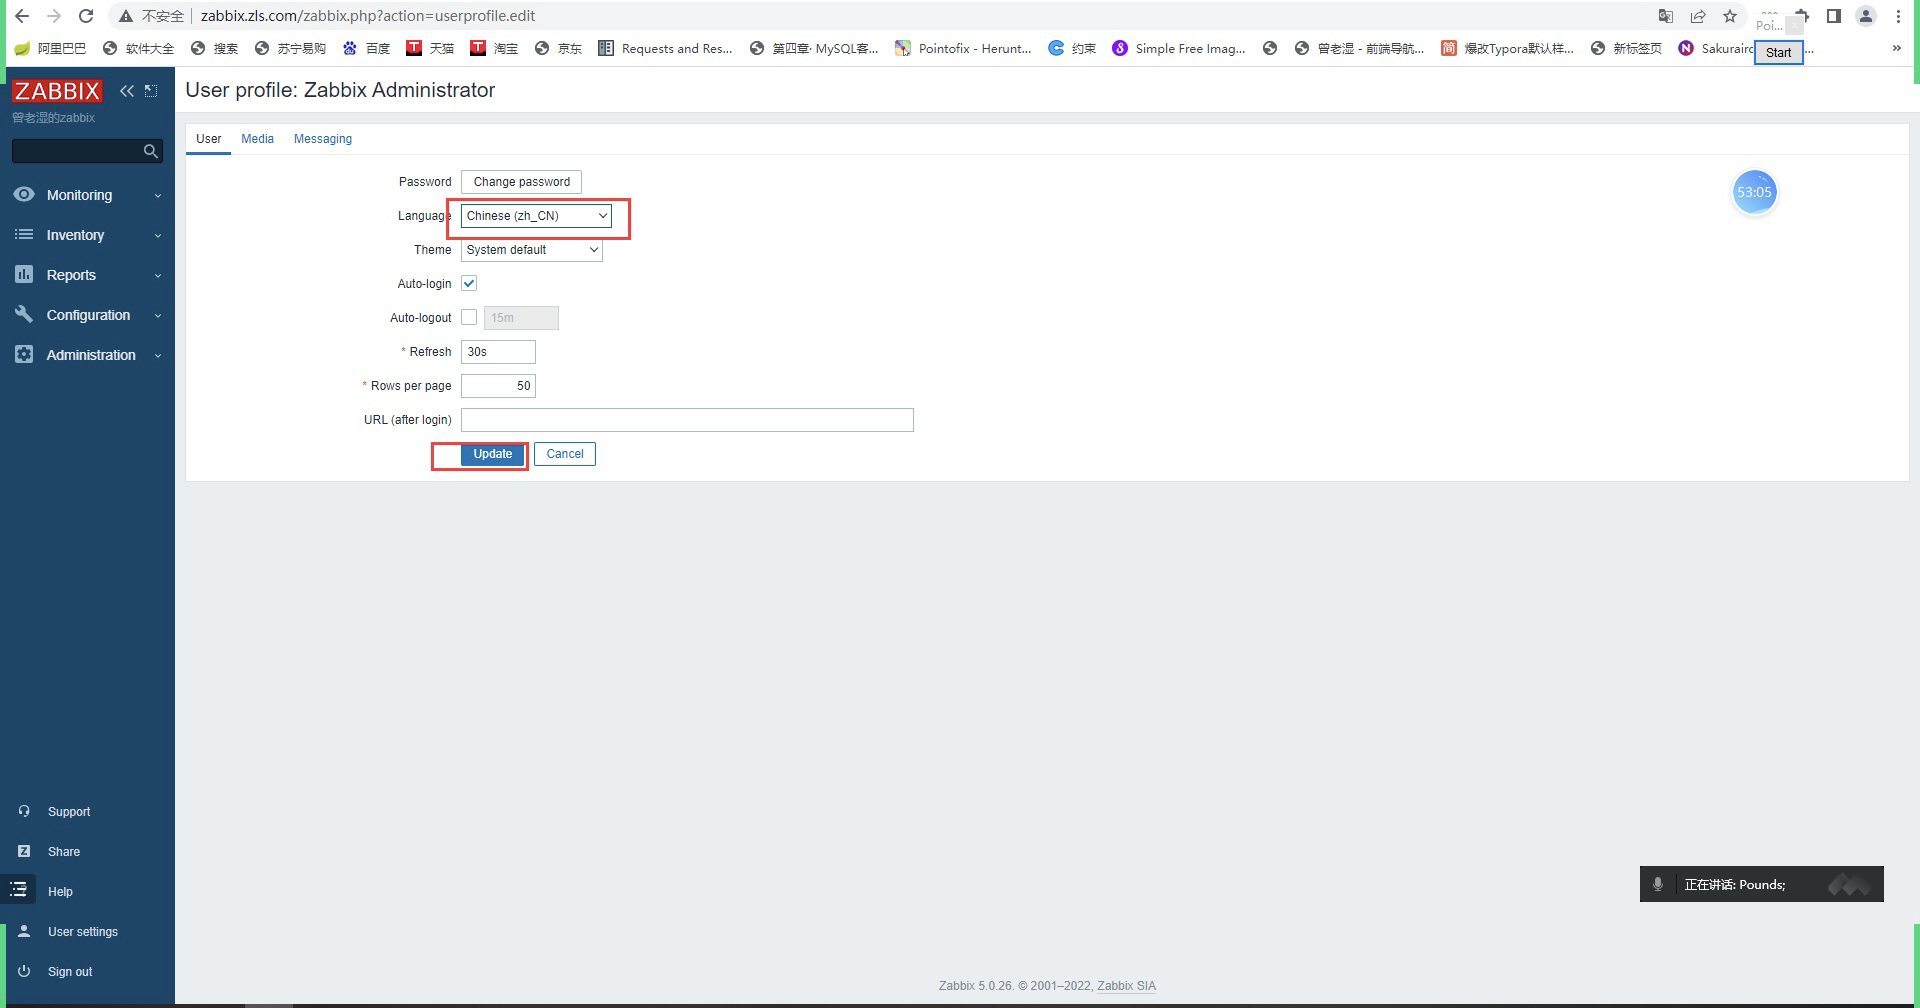
汉化zabbix
解决汉字无法显示问题
在windows中找到中文字体
C:\Windows\Fonts
1 2 3 4 5 6 7 8 9 10 [root@m01 ~] [root@m01 fonts] [root@m01 fonts]
Zabbix监控入门 为什么做监控 企业中:
1.系统的监控:实际上是对系统不间断的实时监控
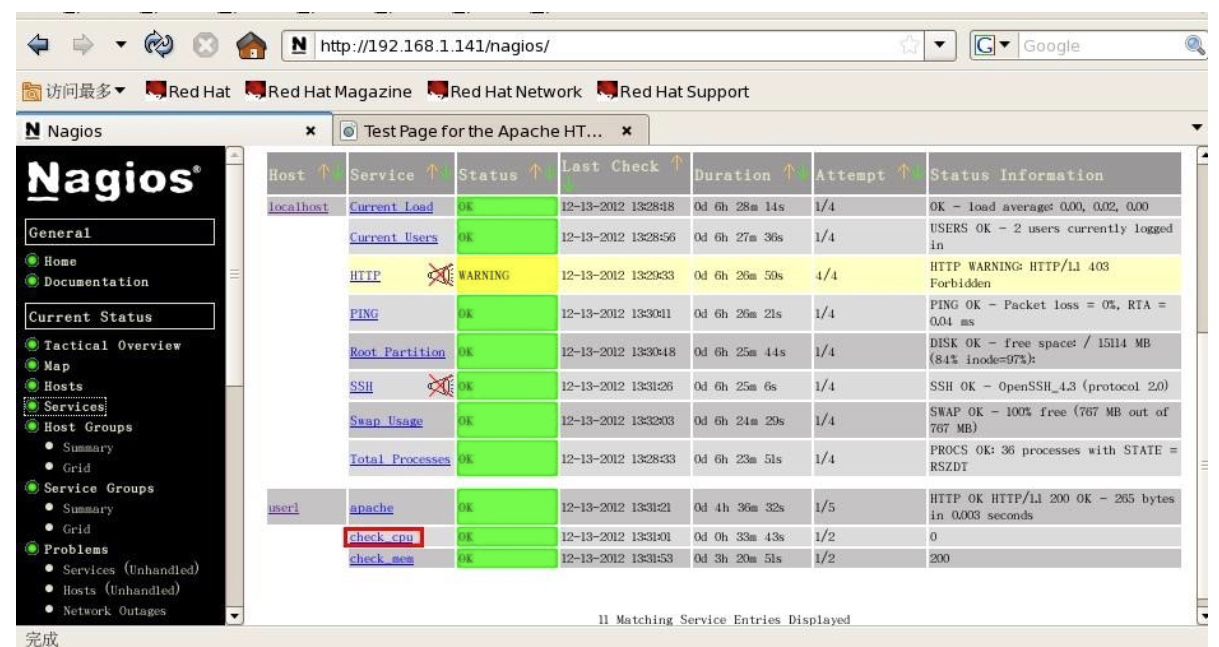
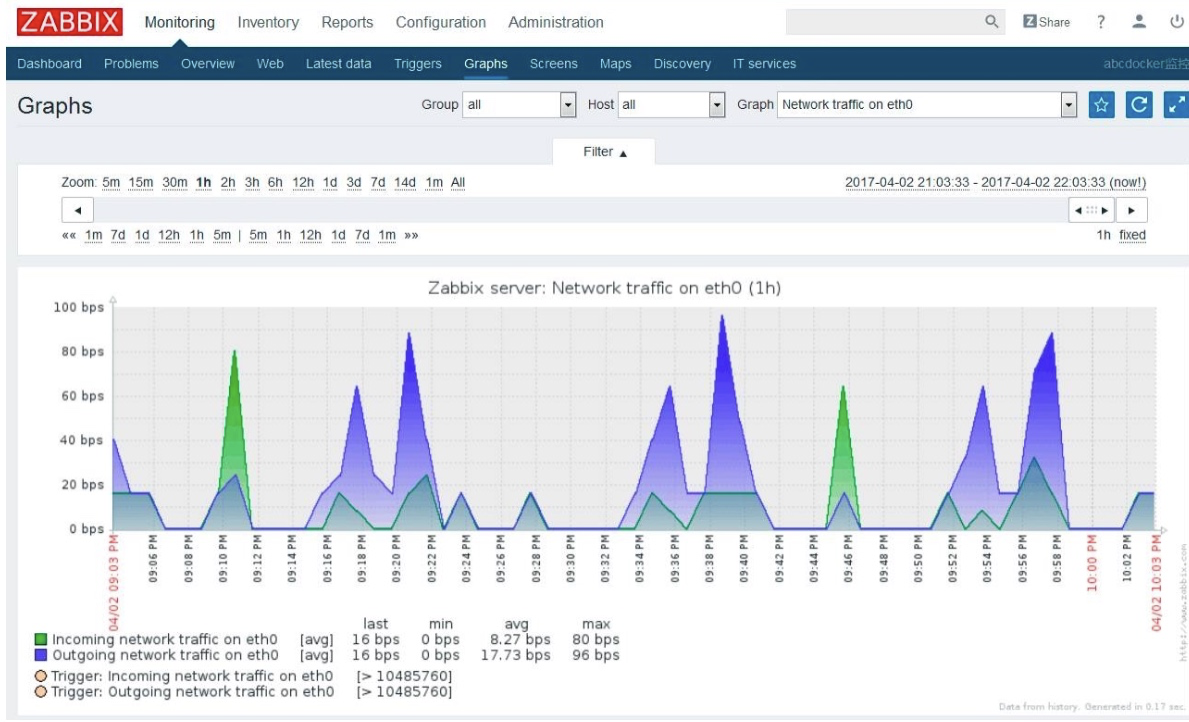
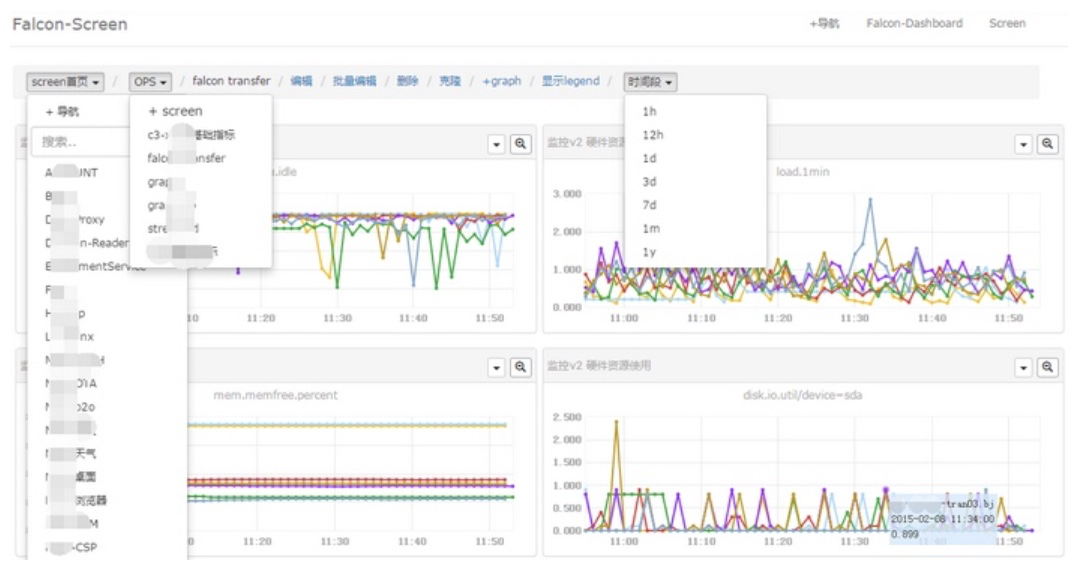
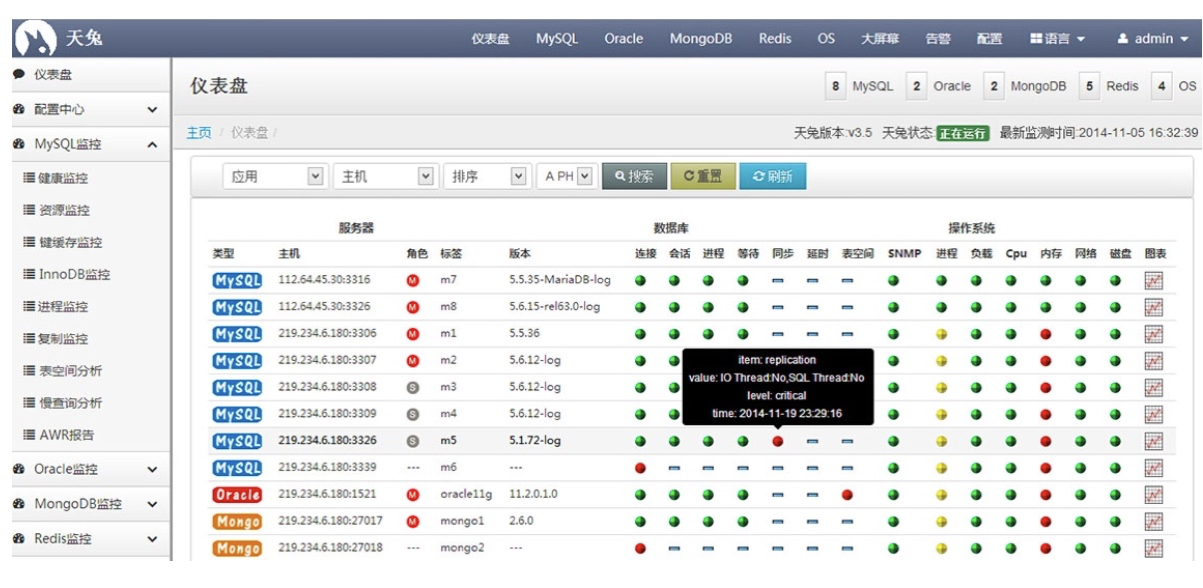
监控软件
面试问题 面试官:你们公司监控是如何做的?
监控软件我们使用的是zabbix,我们监控在不同的维度
硬件层面 Dell R710 R720 R730
如果不使用dell的idrac那就使用zabbix的IPMI接口监控硬件
1)CPU温度,
…..
云主机,不需要说硬件层,一般云主机都自带,硬件监控
系统层面
网络层面
应用层面
nginx
MySQL
进程
端口
主从复制
SQL读写速率
是否可以登录
InnoDB
缓存
表空间
慢查询
tomcat
JMX
垃圾回收
full-gc
进程
端口
网站是否可以访问
redis
进程
端口
连接状态
主从复制 info
集群状态
key,缓存
NFS、GFS(集群式的NFS)、Ceph、FastDFS
PHP
进程
端口(socket)
网站访问情况
php info
….
业务层面
单机监控命令 CPU监控命令 1 2 3 4 5 6 7 8 9 10 11 12 13 14 [root@zabbix-server ~] 18:50:38 up 2:03, 3 users, load average: 0.01, 0.06, 0.06 [root@zabbix-server ~] [root@zabbix-server ~] [root@zabbix-server ~] [root@zabbix-server ~] [root@zabbix-server ~]
1 2 3 4 5 6 7 8 9 10 11 12 13 14 15 16 17 18 19 20 21 22 23 24 25 26 27 28 29 30 31 32 33 34 35 36 37 38 39 40 41 42 43 44 45 46 47 48 49 50 51 52 53 54 55 56 57 58 [root@zabbix-server ~] 18:59:32 up 2:12, 3 users, load average: 0.00, 0.06, 0.06 [root@zabbix-server ~] Architecture: x86_64 CPU op-mode(s): 32-bit, 64-bit Byte Order: Little Endian CPU(s): 1 On-line CPU(s) list: 0 Thread(s) per core: 1 Core(s) per socket: 1 Socket(s): 1 NUMA node(s): 1 Vendor ID: GenuineIntel CPU family: 6 Model: 158 Model name: Intel(R) Core(TM) i5-7400 CPU @ 3.00GHz Stepping: 9 CPU MHz: 3000.001 CPU max MHz: 0.0000 CPU min MHz: 0.0000 BogoMIPS: 6000.00 Hypervisor vendor: VMware Virtualization type : full L1d cache: 32K L1i cache: 32K L2 cache: 256K L3 cache: 6144K NUMA node0 CPU(s): 0 Flags: fpu vme de pse tsc msr pae mce cx8 apic sep mtrr pge mca cmov pat pse36 clflush dts mmx fxsr sse sse2 ss syscall nx pdpe1gb rdtscp lm constant_tsc arch_perfmon pebs bts nopl xtopology tsc_reliable nonstop_tsc aperfmperf eagerfpu pni pclmulqdq ssse3 fma cx16 pcid sse4_1 sse4_2 x2apic movbe popcnt tsc_deadline_timer aes xsave avx f16c rdrand hypervisor lahf_lm abm 3dnowprefetch epb fsgsbase tsc_adjust bmi1 avx2 smep bmi2 invpcid rdseed adx smap xsaveopt xsavec xgetbv1 dtherm ida arat pln pts hwp hwp_notify hwp_act_window hwp_epp [root@zabbix-server ~] processor : 0 vendor_id : GenuineIntel cpu family : 6 model : 158 model name : Intel(R) Core(TM) i5-7400 CPU @ 3.00GHz stepping : 9 microcode : 0x8e cpu MHz : 3000.001 cache size : 6144 KB physical id : 0 siblings : 1 core id : 0 cpu cores : 1 apicid : 0 initial apicid : 0 fpu : yes fpu_exception : yes cpuid level : 22 wp : yes flags : fpu vme de pse tsc msr pae mce cx8 apic sep mtrr pge mca cmov pat pse36 clflush dts mmx fxsr sse sse2 ss syscall nx pdpe1gb rdtscp lm constant_tsc arch_perfmon pebs bts nopl xtopology tsc_reliable nonstop_tsc aperfmperf eagerfpu pni pclmulqdq ssse3 fma cx16 pcid sse4_1 sse4_2 x2apic movbe popcnt tsc_deadline_timer aes xsave avx f16c rdrand hypervisor lahf_lm abm 3dnowprefetch epb fsgsbase tsc_adjust bmi1 avx2 smep bmi2 invpcid rdseed adx smap xsaveopt xsavec xgetbv1 dtherm ida arat pln pts hwp hwp_notify hwp_act_window hwp_epp bogomips : 6000.00 clflush size : 64 cache_alignment : 64 address sizes : 42 bits physical, 48 bits virtual power management:
不管用什么命令监控,查看CPU,我们都必须了解,系统的用户态和内和态。
1 2 3 4 5 6 7 8 9 10 11 12 13 14 %Cpu(s): 0.0 us, 0.0 sy, 0.0 ni,100.0 id, 0.0 wa, 0.0 hi, 0.0 si, 0.0 st us: 用户态 跟用户的操作有关35% sy: 内和态 跟内核的处理有关65% id: CPU空闲 当我们执行一个命令的时候,很快能出来结果,但是有多少人知道,这个很快,他都占用了哪些时间呢? [root@zabbix-server ~] anaconda-ks.cfg zabbix-server-mysql-4.0.0-2.el7.x86_64.rpm zabbix-agent-4.0.0-2.el7.x86_64.rpm zabbix-web-mysql-4.0.0-2.el7.noarch.rpm real 0m0.032s user 0m0.002s sys 0m0.005s
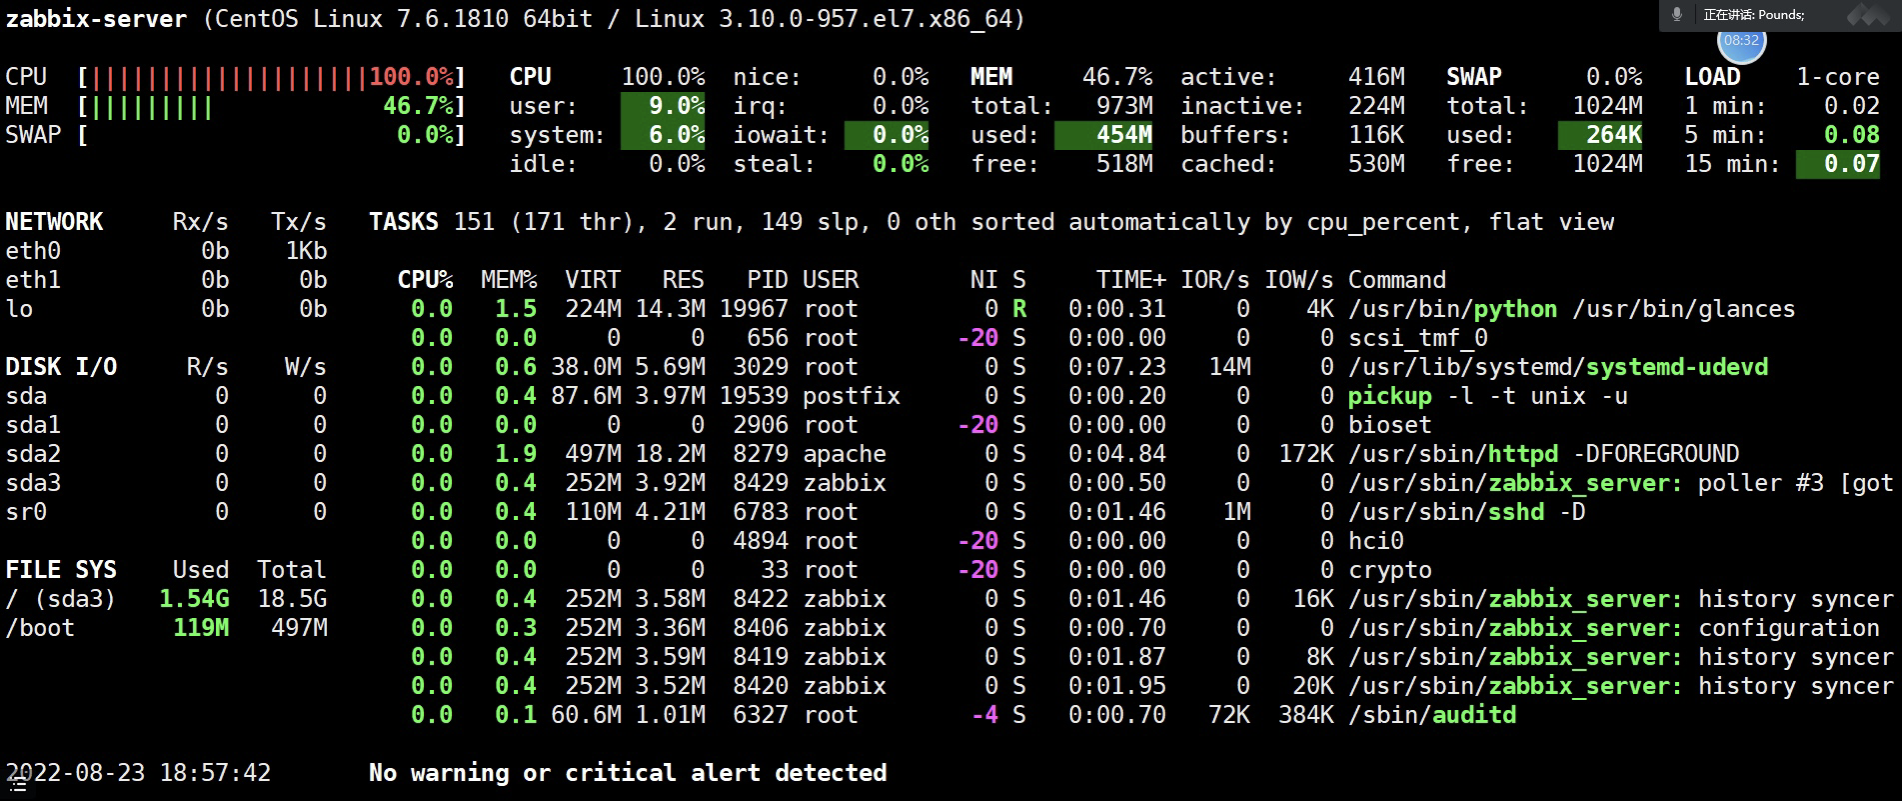
监控内存 1 2 3 4 5 6 7 8 9 10 11 12 13 14 15 16 17 18 19 20 21 22 23 24 25 26 27 28 29 30 31 32 33 34 35 36 37 38 39 40 41 42 43 44 45 46 47 48 49 50 51 52 53 54 55 56 57 58 59 60 61 62 63 64 65 66 67 68 69 70 71 72 73 74 75 76 1)free [root@zabbix-server ~] total used free shared buff/cache available Mem: 0 0 0 0 0 0 Swap: 0 0 0 [root@zabbix-server ~] total used free shared buff/cache available Mem: 972 234 158 8 579 528 Swap: 1023 0 1023 [root@zabbix-server ~] total used free shared buff/cache available Mem: 972M 234M 158M 8.4M 579M 528M Swap: 1.0G 264K 1.0G 2)top 3)glances 4)htop 5)lsmem [root@zabbix-server ~] RANGE SIZE STATE REMOVABLE BLOCK 0x0000000000000000-0x000000003fffffff 1G online no 0-7 Memory block size: 128M Total online memory: 1G Total offline memory: 0B 6)cat /proc/meminfo [root@zabbix-server ~] MemTotal: 995896 kB MemFree: 159908 kB MemAvailable: 541596 kB Buffers: 116 kB Cached: 489248 kB SwapCached: 4 kB Active: 418768 kB Inactive: 227568 kB Active(anon): 137052 kB Inactive(anon): 28476 kB Active(file): 281716 kB Inactive(file): 199092 kB Unevictable: 0 kB Mlocked: 0 kB SwapTotal: 1048572 kB SwapFree: 1048308 kB Dirty: 20 kB Writeback: 0 kB AnonPages: 157000 kB Mapped: 33420 kB Shmem: 8556 kB Slab: 107040 kB SReclaimable: 57164 kB SUnreclaim: 49876 kB KernelStack: 4752 kB PageTables: 22648 kB NFS_Unstable: 0 kB Bounce: 0 kB WritebackTmp: 0 kB CommitLimit: 1546520 kB Committed_AS: 928904 kB VmallocTotal: 34359738367 kB VmallocUsed: 177304 kB VmallocChunk: 34359310332 kB HardwareCorrupted: 0 kB AnonHugePages: 51200 kB CmaTotal: 0 kB CmaFree: 0 kB HugePages_Total: 0 HugePages_Free: 0 HugePages_Rsvd: 0 HugePages_Surp: 0 Hugepagesize: 2048 kB DirectMap4k: 57216 kB DirectMap2M: 991232 kB DirectMap1G: 0 kB
如何查看单个进程占用内存?
1 2 3 pmem = VmRSS / MemTotal * 100 process mem = 虚拟内存 / 总内存 * 100
python脚本获取进程使用内存情况 1 2 3 4 5 6 7 8 9 10 11 12 13 14 15 16 17 18 19 20 21 22 23 24 25 26 27 28 29 30 31 32 33 34 35 36 37 38 39 40 41 42 43 44 45 46 47 48 49 50 51 52 53 54 55 56 57 58 59 60 61 62 63 64 65 66 67 68 69 70 71 72 73 74 75 76 [root@zabbix-server ~] import sys import os from subprocess import Popen,PIPE def get_pid(program): '获取目标程序的PID列表' p = Popen(['pidof' ,program],stdout=PIPE,stderr=PIPE) pids,stderrput = p.communicate() if pids: return pids.split() else : raise ValueError def mem_calc(pids): '计算PIDs占用的内存大小' mem_total = 0 for pid in pids: os.chdir('/proc/%s' % pid) with open('status' ) as fd: for line in fd: if line.startswith('VmRSS' ): mem = line.strip().split()[1] mem_total += int(mem) break return mem_total def mem_percent(mem): '计算程序内存占用物理内存的百分比' with open('/proc/meminfo' ) as fd: for line in fd: if line.startswith('MemTotal' ): total = line.strip().split()[1] percent = (float (mem)/int(total)) * 100 return percent def main(): try: program = sys.argv[1] pids = get_pid(program) except IndexError as e: sys.exit('%s need a Program name ' % __file__) except ValueError as e: sys.exit('%s not a Process Name or not Start' % program ) mem_total = mem_calc(pids) percent = mem_percent(mem_total) return program,mem_total,percent if __name__ == '__main__' : program,mem_total,mem_percent=main() print ('进程名称:%s\n物理内存为:%s\n百分比为:%.2f%%' % (program,mem_total,mem_percent)) [root@zabbix-server ~] 进程名称:zabbix_agentd 物理内存为:12332 百分比为:1.24% [root@zabbix-server ~] 进程名称:zabbix_server 物理内存为:115300 百分比为:11.58% [root@zabbix-server ~] 进程名称:httpd 物理内存为:212148 百分比为:21.30%
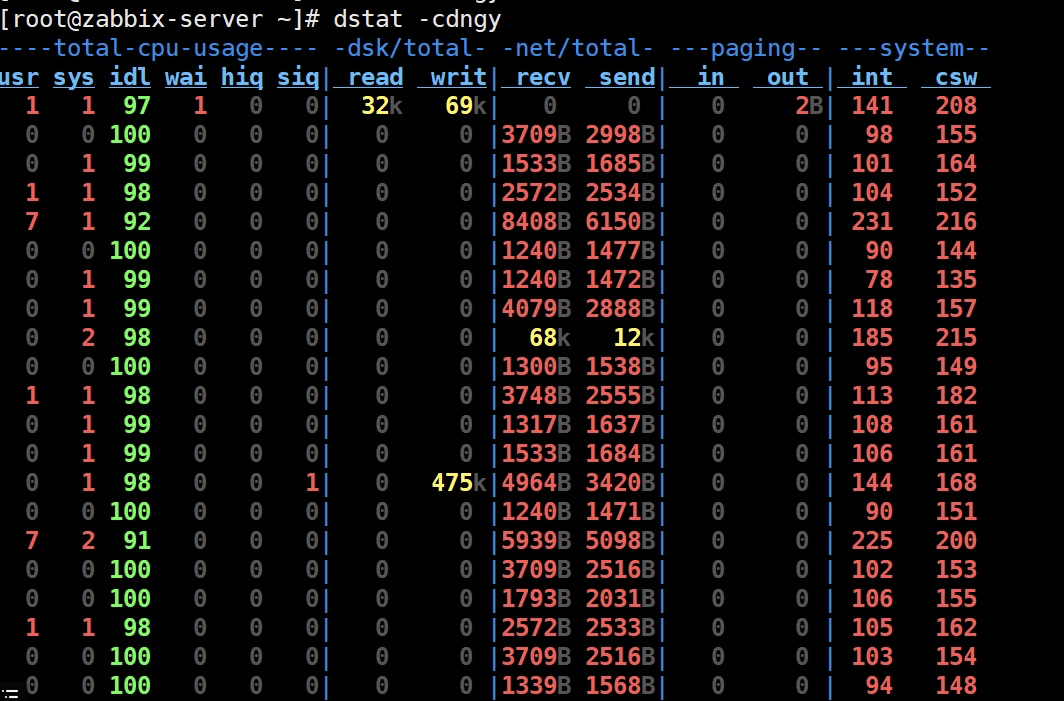
监控磁盘命令 1 2 3 4 5 6 7 8 9 10 11 12 13 14 15 16 17 18 19 20 21 22 23 24 25 26 27 28 29 30 31 32 33 34 35 36 37 38 39 40 41 42 43 44 45 46 1)df [root@zabbix-server ~] Filesystem Inodes IUsed IFree IUse% Mounted on /dev/sda3 9704960 38522 9666438 1% / devtmpfs 121762 377 121385 1% /dev tmpfs 124487 1 124486 1% /dev/shm tmpfs 124487 746 123741 1% /run tmpfs 124487 16 124471 1% /sys/fs/cgroup /dev/sda1 256000 326 255674 1% /boot tmpfs 124487 1 124486 1% /run/user/0 [root@zabbix-server ~] Filesystem Size Used Avail Use% Mounted on /dev/sda3 19G 1.6G 17G 9% / devtmpfs 476M 0 476M 0% /dev tmpfs 487M 0 487M 0% /dev/shm tmpfs 487M 7.8M 479M 2% /run tmpfs 487M 0 487M 0% /sys/fs/cgroup /dev/sda1 497M 120M 378M 25% /boot tmpfs 98M 0 98M 0% /run/user/0 [root@zabbix-server ~] Filesystem Inodes IUsed IFree IUse% Mounted on /dev/sda3 9.3M 38K 9.3M 1% / devtmpfs 119K 377 119K 1% /dev tmpfs 122K 1 122K 1% /dev/shm tmpfs 122K 746 121K 1% /run tmpfs 122K 16 122K 1% /sys/fs/cgroup /dev/sda1 250K 326 250K 1% /boot tmpfs 122K 1 122K 1% /run/user/0 2)iotop查看进程对磁盘的使用情况,IO吞吐量情况 [root@zabbix-server ~] Total DISK READ : 0.00 B/s | Total DISK WRITE : 0.00 B/s Actual DISK READ: 0.00 B/s | Actual DISK WRITE: 0.00 B/s 3)查看磁盘的IO吞吐量 -d:指定多久出一次结果 单位是秒 -m:指定出几次结果 [root@zabbix-server ~] Linux 3.10.0-957.el7.x86_64 (zabbix-server) 08/23/2022 _x86_64_ (1 CPU) Device: tps MB_read/s MB_wrtn/s MB_read MB_wrtn scd0 0.00 0.00 0.00 1 0 sda 2.17 0.03 0.07 284 607 [root@zabbix-server ~] [root@zabbix-server ~]
1 2 3 4 5 6 7 8 9 10 11 12 13 14 15 16 17 18 19 20 21 22 23 24 25 26 27 28 29 30 31 32 33 34 35 36 5)glances 6)lsblk [root@zabbix-server ~] NAME MAJ:MIN RM SIZE RO TYPE MOUNTPOINT sda 8:0 0 20G 0 disk ├─sda1 8:1 0 500M 0 part /boot ├─sda2 8:2 0 1G 0 part [SWAP] └─sda3 8:3 0 18.5G 0 part / sr0 11:0 1 4.3G 0 rom [root@zabbix-server ~] [root@zabbix-server ~] [root@zabbix-server ~] [root@zabbix-server ~] [root@zabbix-server ~] /dev/loop0 3.9M 53K 3.5M 2% /opt/cipan1 [root@zabbix-server ~] UUID=b2503fb9-fc5e-47fc-b86a-d171a5fbf689 /opt/cipan1 ext4 defaults 0 0 [root@zabbix-server ~] /dev/sda1: UUID="33bce62e-082b-4647-8b36-9335a0cc6600" TYPE="xfs" [root@zabbix-server ~] /dev/sda3: UUID="9e1a4ad0-69bf-4b9e-9aa0-4820ec625963" TYPE="xfs" [root@zabbix-server ~] /dev/loop0: UUID="b2503fb9-fc5e-47fc-b86a-d171a5fbf689" TYPE="ext4"
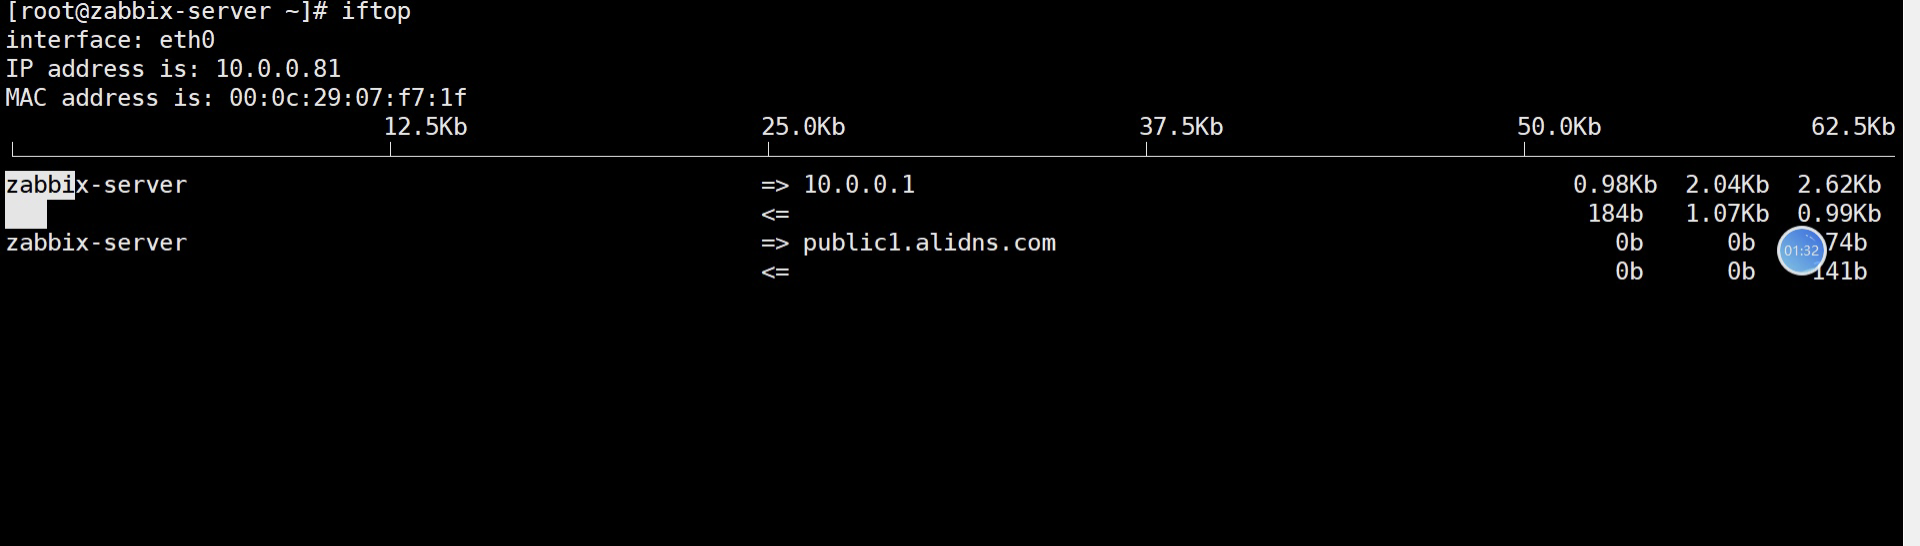
网络监控命令 1 2 3 4 5 6 7 8 1)glances NETWORK Rx/s Tx/s eth0 592b 15Kb eth1 17Kb 13Kb lo 0b 0b 2)iftop [root@zabbix-server ~]
1 2 3 4 5 6 7 8 9 10 11 12 13 14 15 16 3)nethogs [root@zabbix-server ~] [root@zabbix-server ~] 4) ifconfig [root@zabbix-server ~] 5)路由 [root@zabbix-server ~] Kernel IP routing table Destination Gateway Genmask Flags Metric Ref Use Iface 0.0.0.0 10.0.0.2 0.0.0.0 UG 0 0 0 eth0 10.0.0.0 0.0.0.0 255.255.255.0 U 0 0 0 eth0 169.254.0.0 0.0.0.0 255.255.0.0 U 1002 0 0 eth0 169.254.0.0 0.0.0.0 255.255.0.0 U 1003 0 0 eth1 172.16.1.0 0.0.0.0 255.255.255.0 U 0 0 0 eth1
TCP11种状态监控命令 1 2 3 4 5 6 7 8 9 10 11 12 13 14 [root@zabbix-server ~] [root@zabbix-server ~] 26 ESTABLISHED 11 LISTEN 48 TIME_WAIT [root@zabbix-server ~] LISTEN 11 ESTABLISHED 25 FIN_WAIT2 1 TIME_WAIT 53
生产场景需求 1 2 3 4 5 6 7 8 9 10 11 12 13 14 15 16 17 18 19 20 21 22 23 24 1.如何获取内存的状态信息 free -m 2.如何获取内存的可用状态 free -m|awk '/Mem/{print $NF}' 3.如何进行数字的比对,高于100MB不处理,低于100MB,发送邮件。 4.如何每分钟执行。 [root@web02 ~] #!/bin/bash while true ;do free_av=$(free -m|awk '/^Mem/{print $NF}' ) Hostname=$(hostname)_$(hostname -I|awk '{print $2}' ) Date=$(date +%F) if [ $free_av -lt 100 ];then echo "$Date : ${Hostname} ,内存低于100MB,还有${free_av} MB内存可用" fi sleep 2 done [root@web02 ~] 2018-10-12: web02_,内存低于100MB,还有20MB内存可用 2018-10-12: web02_,内存低于100MB,还有6MB内存可用 2018-10-12: web02_,内存低于100MB,还有5MB内存可用
系统的oom 1 2 3 4 5 6 7 8 9 10 11 12 13 14 15 16 [root@zabbix-server ~] 随着时间的推移,用户不断增多,服务消耗的内存越来越多,当系统内存不足的时候,可能会导致系统产生oom(out of memory) 1.当系统内存不足时就会大量使用swap(虚拟内存) 2.当系统大量使用swap的时候,系统会特别卡 注意:有时可能内存还有剩余300M或者500M,但是swap依然被使用 [root@web02 ~] [root@web02 ~] Out of memory: Kill process 29957 (dd) score 366 or sacrifice child Killed process 29957 (dd) total-vm:2532680kB, anon-rss:1416508kB, filers:0kB Aug 23 20:18:27 localhost kernel: Out of memory: Kill process 22208 (dd) score 599 or sacrifice child Aug 23 20:18:27 localhost kernel: Killed process 22208 (dd) total-vm:722512kB, anon-rss:614508kB, file-rss:0kB, shmem-rss:0kB
使用脚本监控nginx 前面的课程中,我们学习了使用脚本+定时任务的方法自动备份并将检查结果,发到指定邮箱,那么这里,我也可以使用脚本+定时任务的方法,进行监控,并使用邮件报警
1 2 3 4 5 #!/bin/bash nginx_process=`ps -ef|grep -c [n]ginx` if [ $nginx_process -lt 2 ];then echo "目前nginx进程数是:$nginx_process " |mail -s "完犊子nginx挂了" 133411023@qq.com fi
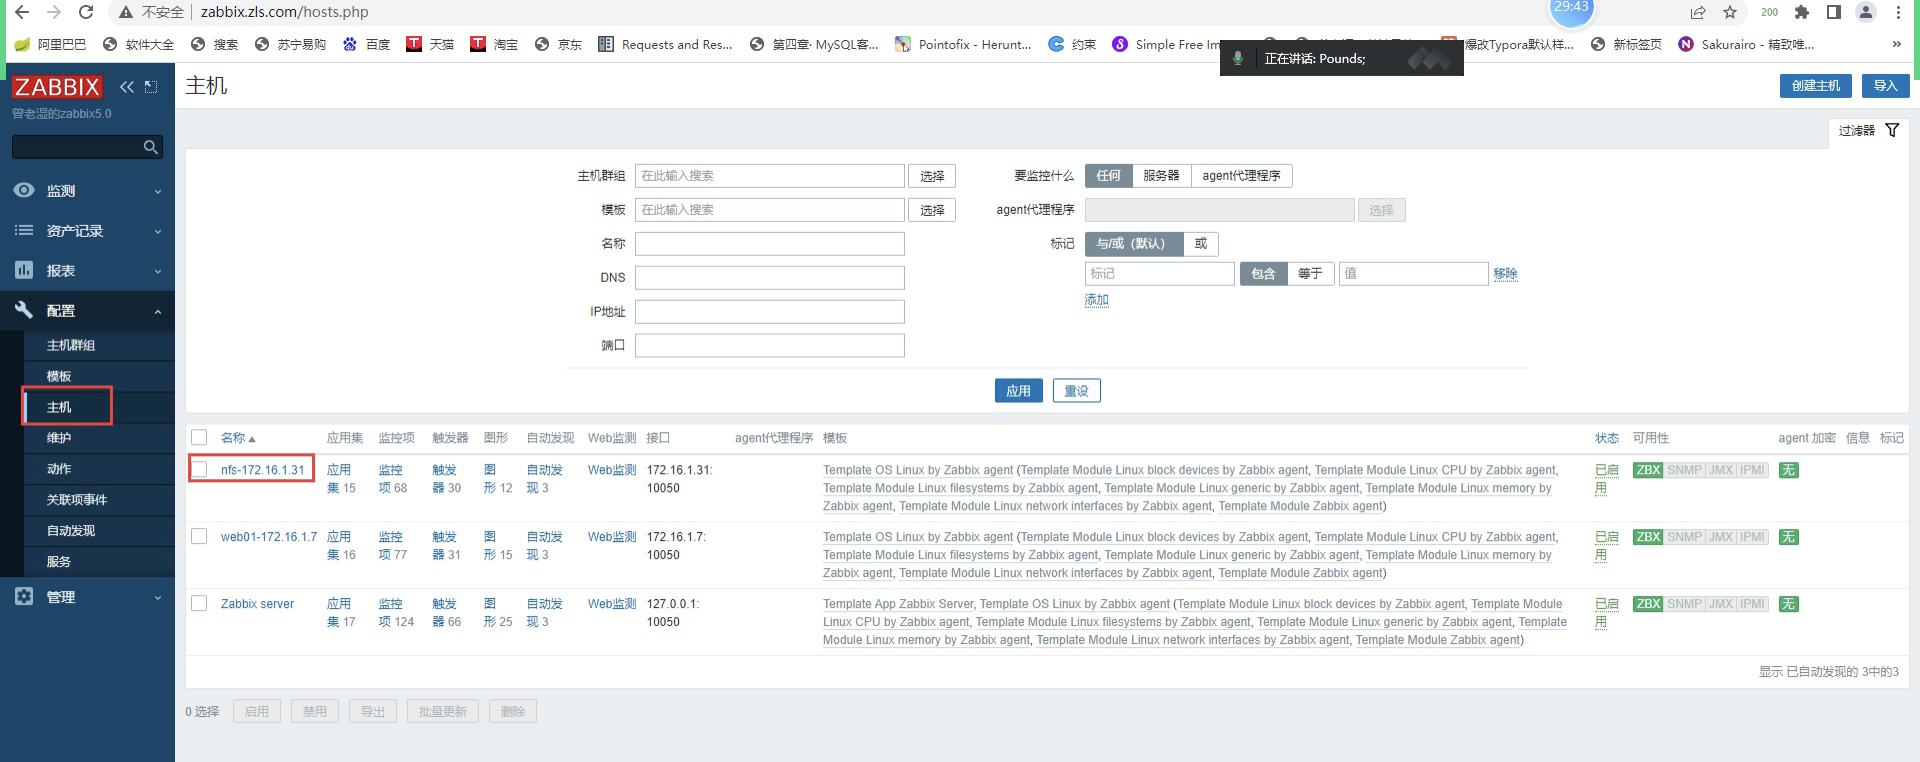
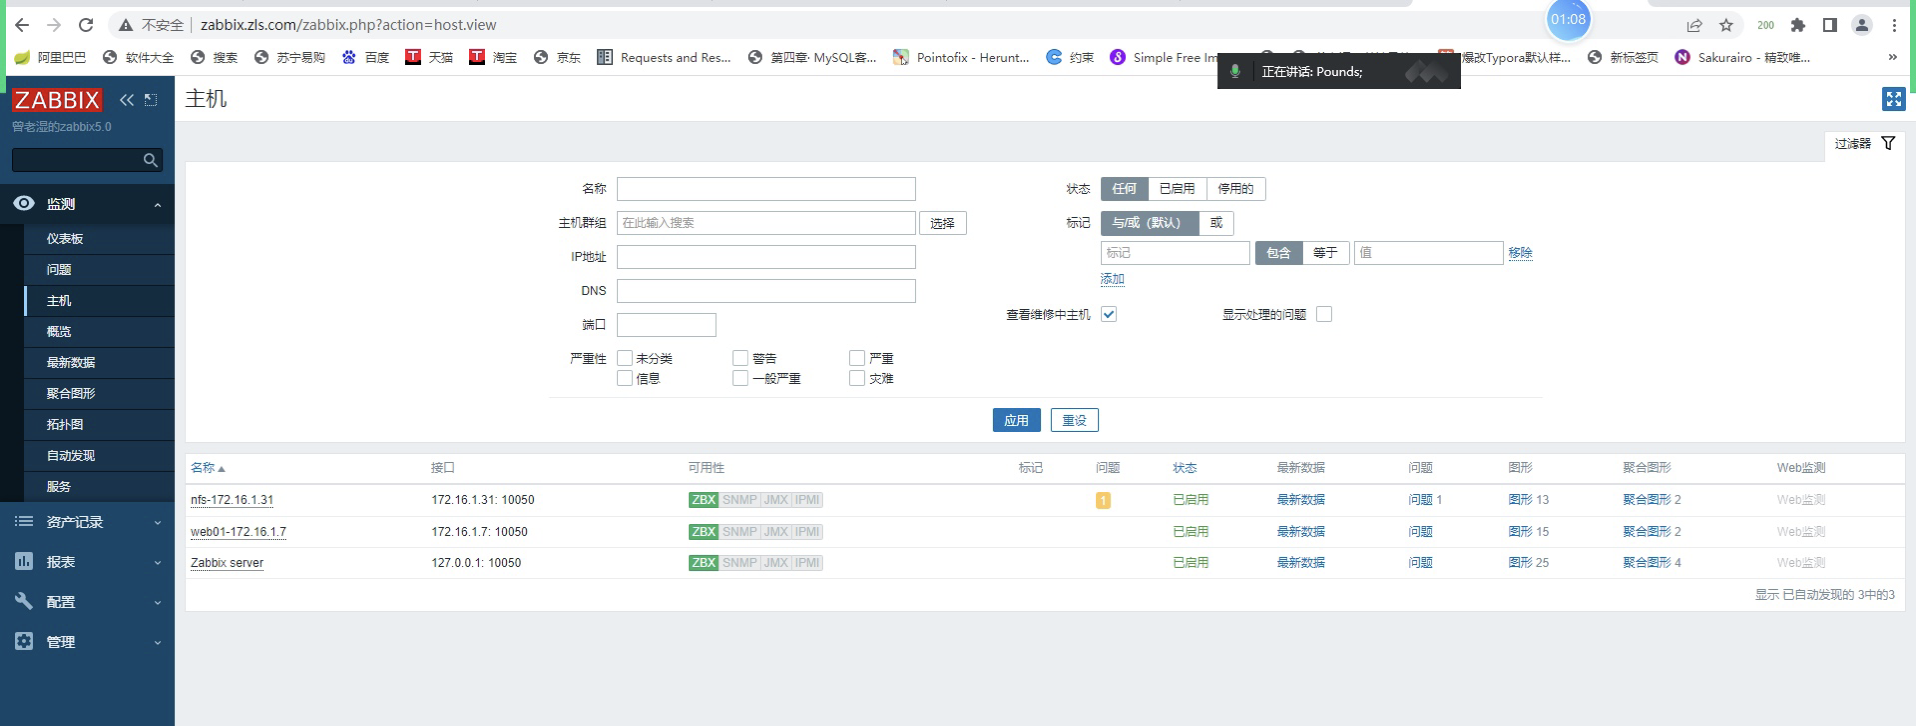
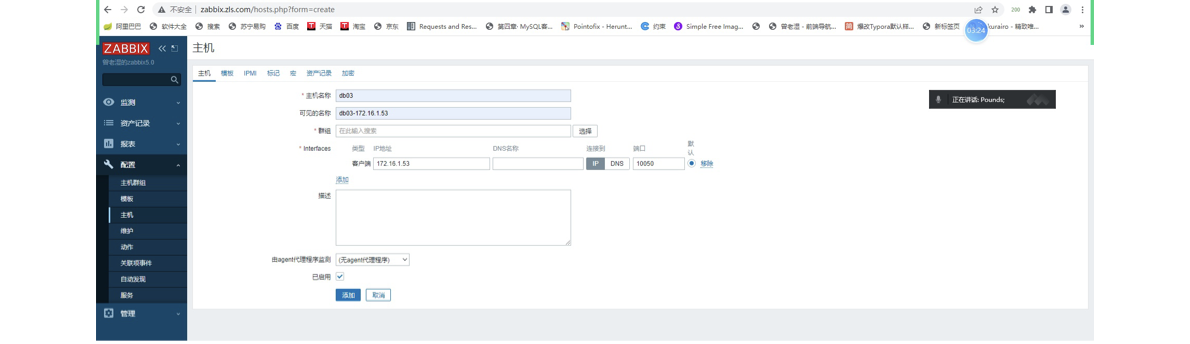
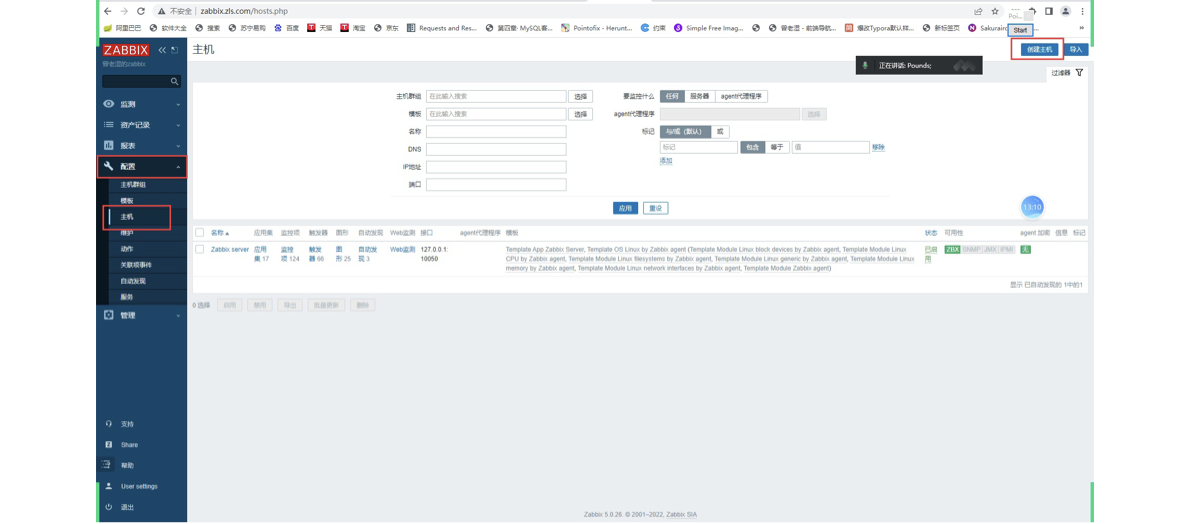
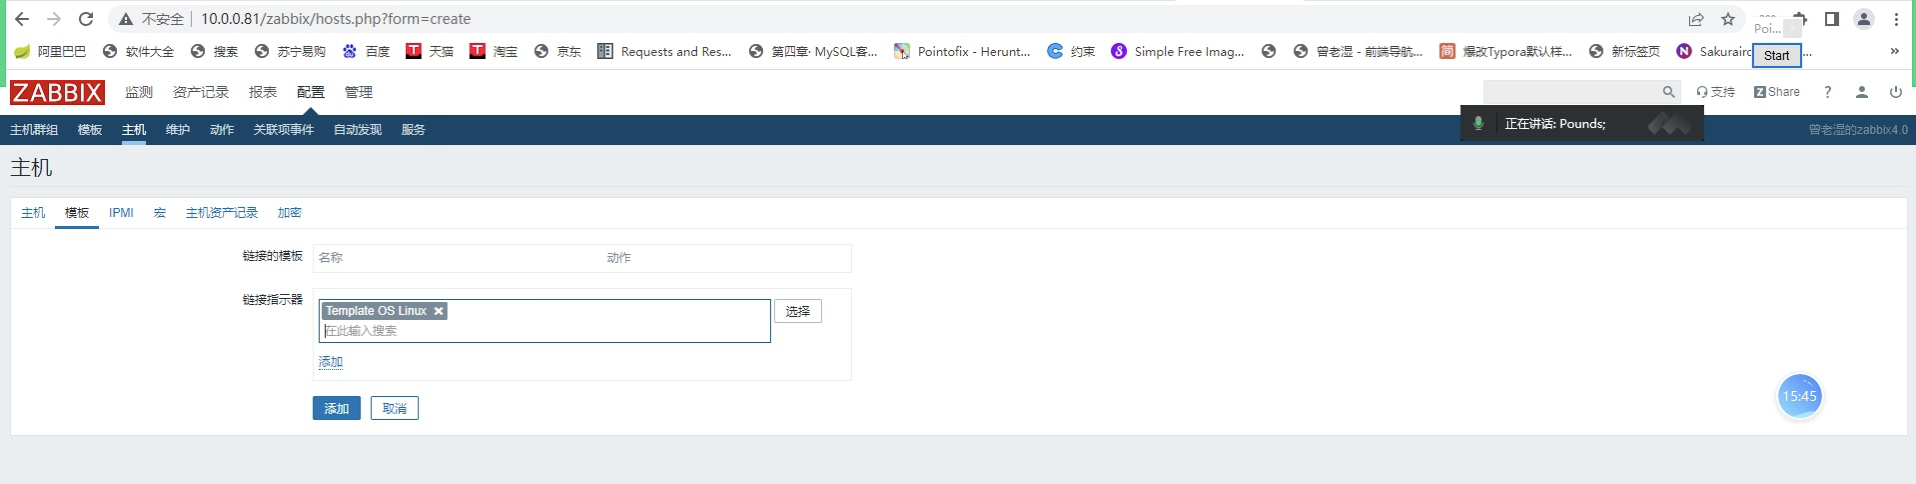
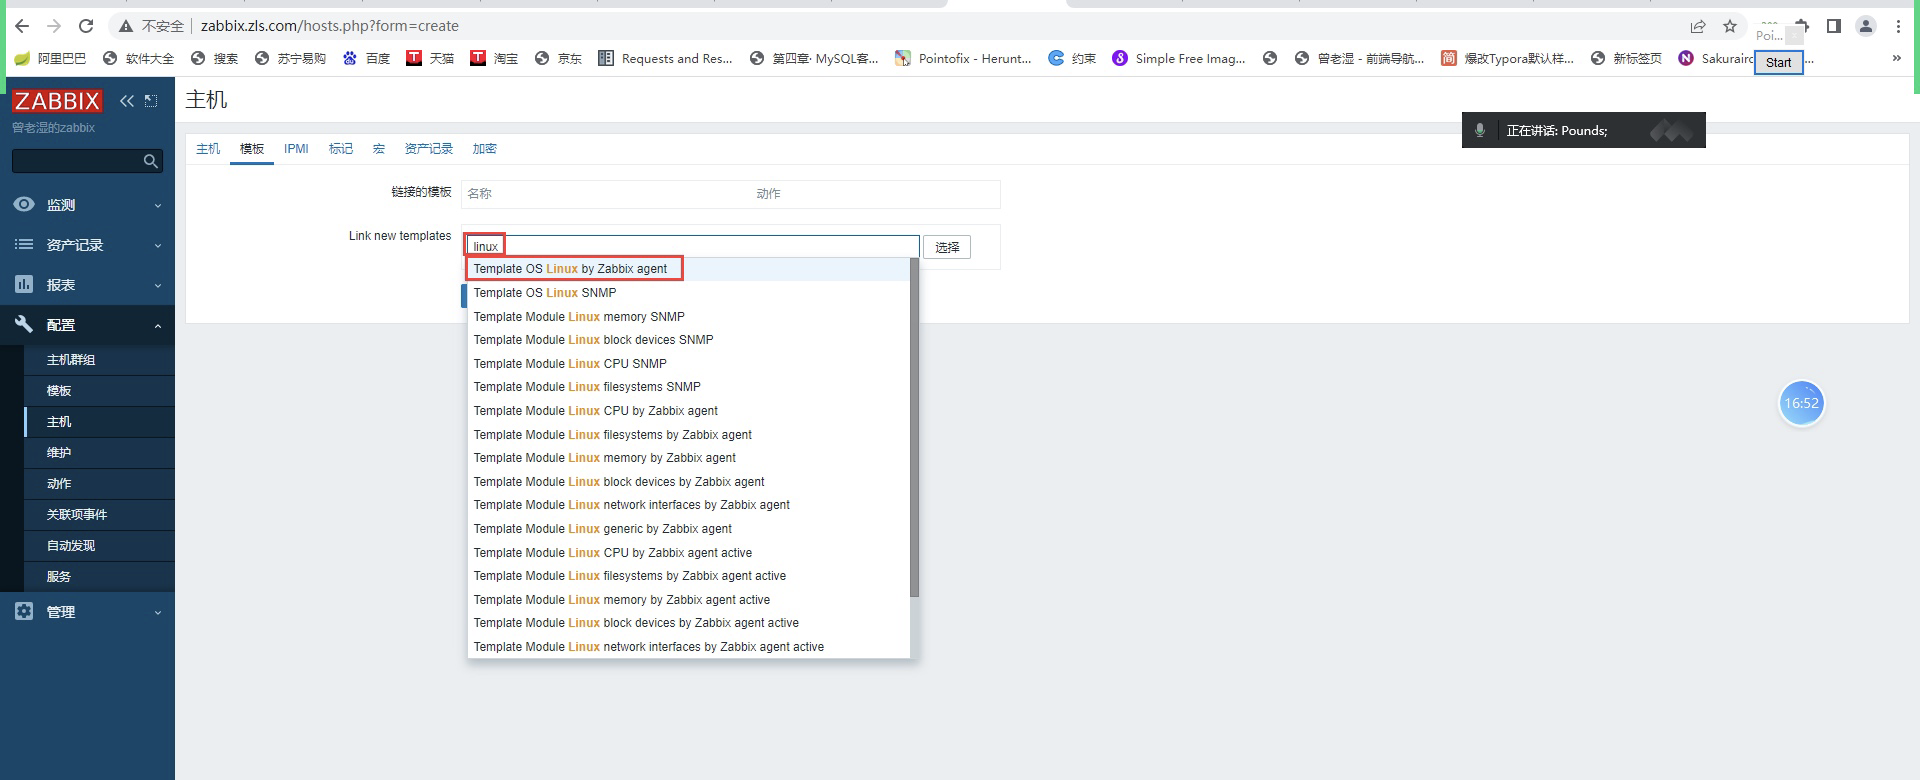
Zabbix自定义监控项 快速监控一台主机 1 2 3 4 5 6 7 8 9 10 11 12 13 14 15 16 17 18 19 20 21 22 23 24 25 [root@m01 fonts] zabbix_server (Zabbix) 5.0.26 [root@db03 ~] [root@db03 ~] [root@web01 ~] [root@web01 ~] Server=172.16.1.61 ServerActive=172.16.1.61 Hostname=web01 [root@web01 ~] [root@web01 ~] tcp 0 0 0.0.0.0:10050 0.0.0.0:* LISTEN 7681/zabbix_agentd tcp6 0 0 :::10050 :::* LISTEN 7681/zabbix_agentd
添加基础模板 zabbix3.x 和 zabbix4.x
zabbix报错排查 1 2 3 4 5 6 7 8 9 10 11 12 13 14 15 16 17 18 19 20 21 [root@zabbix ~] [root@zabbix ~] -s:指定主机IP地址 -k:指定监控项名称 [root@zabbix ~] 100.000000 [root@zabbix ~] 1073737728 [root@zabbix ~] [root@zabbix ~] [root@zabbix ~] [root@zabbix ~]
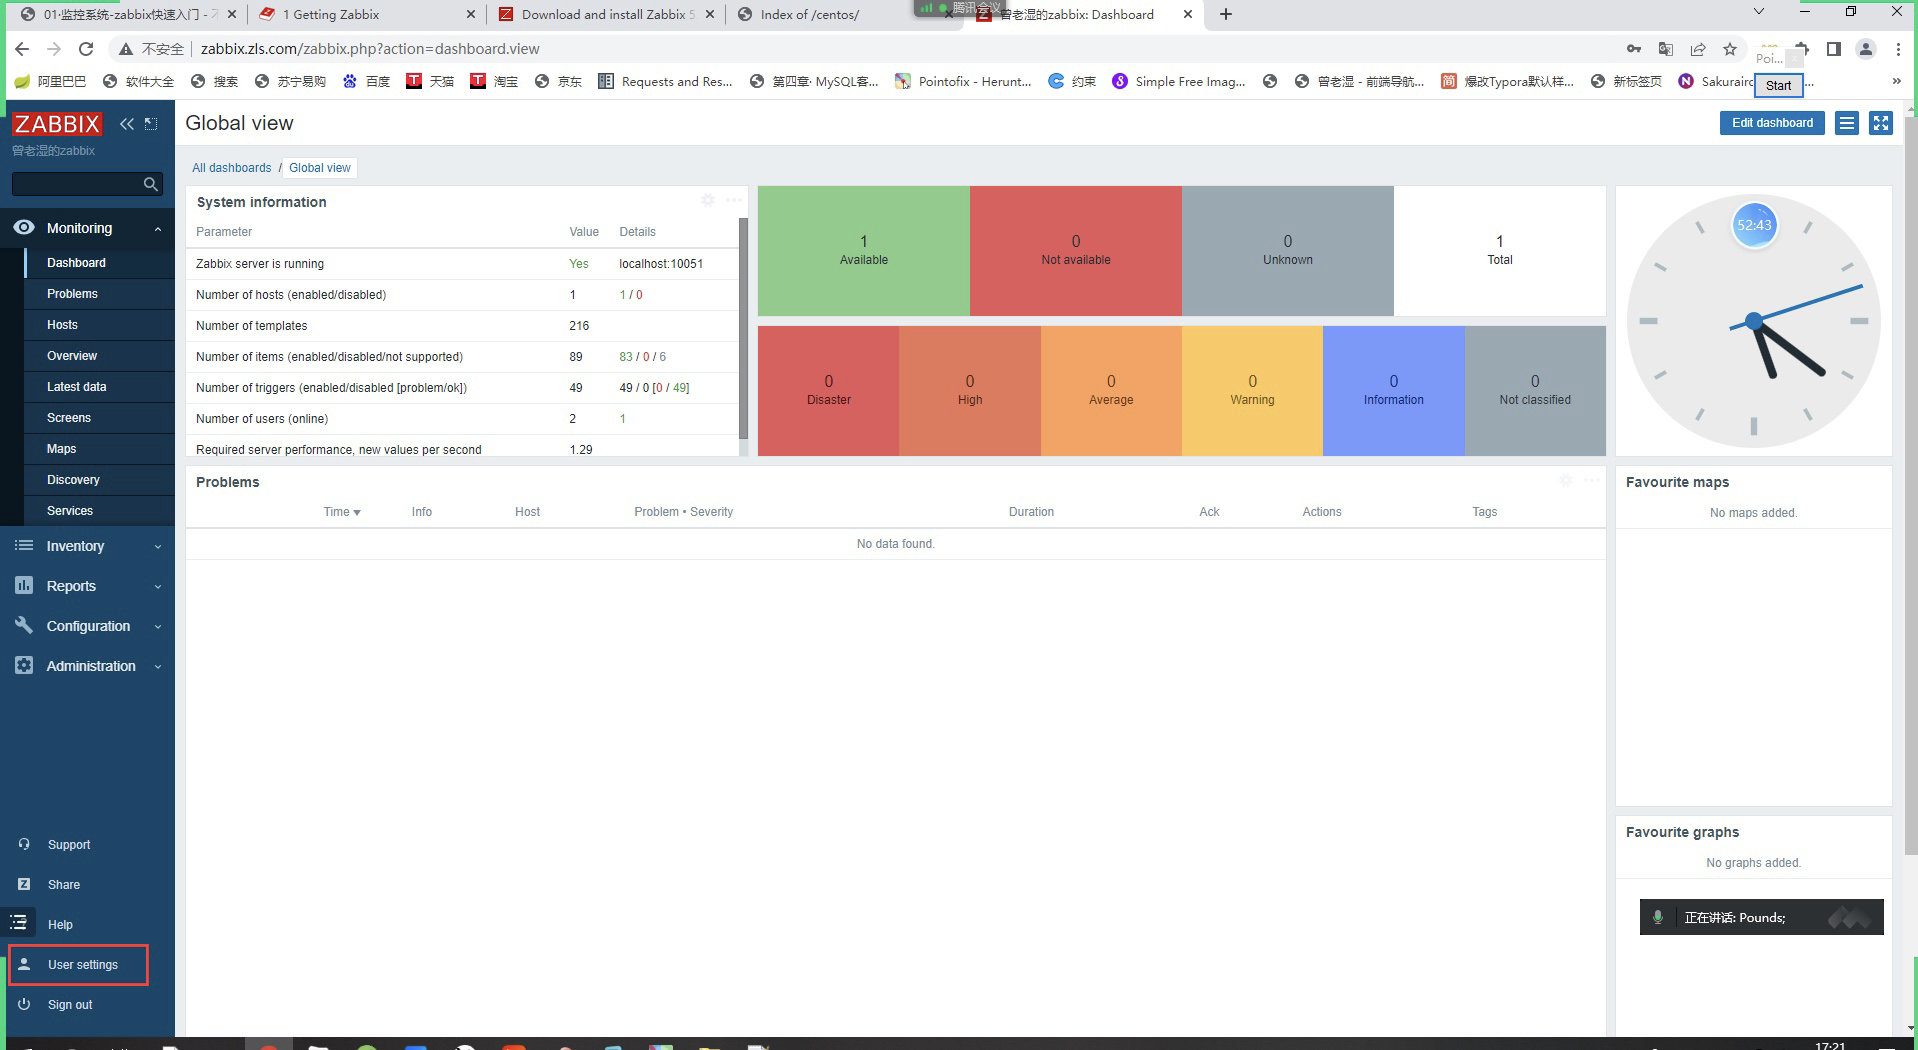
zabbix基础架构 1 2 3 4 5 6 7 8 9 zabbix-agent:获取本机上的数据(主动上交给server) zabbix-server:获取所有agent上的数据,并保存到数据库中 create.sql.gz - 1.systemctl stop zabbix-server - 2.drop database zabbix; - 3.creaete database zabbix charset utf8 collate utf8_bin; - 4.zcat create.sql.gz| mysql -uzabbix -p123 zabbix - 5.rm -f zabbix.conf.php - 6.http://zabbix.zls.com/setup.php // 重新进入配置页面 zabbix-web:页面展示,从数据库中获取数据,展示到页面上
自定义zabbix监控 1 2 3 4 5 6 7 8 9 1.创建一个模板 2.给模板添加监控项 3.给监控项画图 4.给监控项添加触发器 5.给监控项的触发器添加告警动作 - 邮件 - 微信 - 钉钉
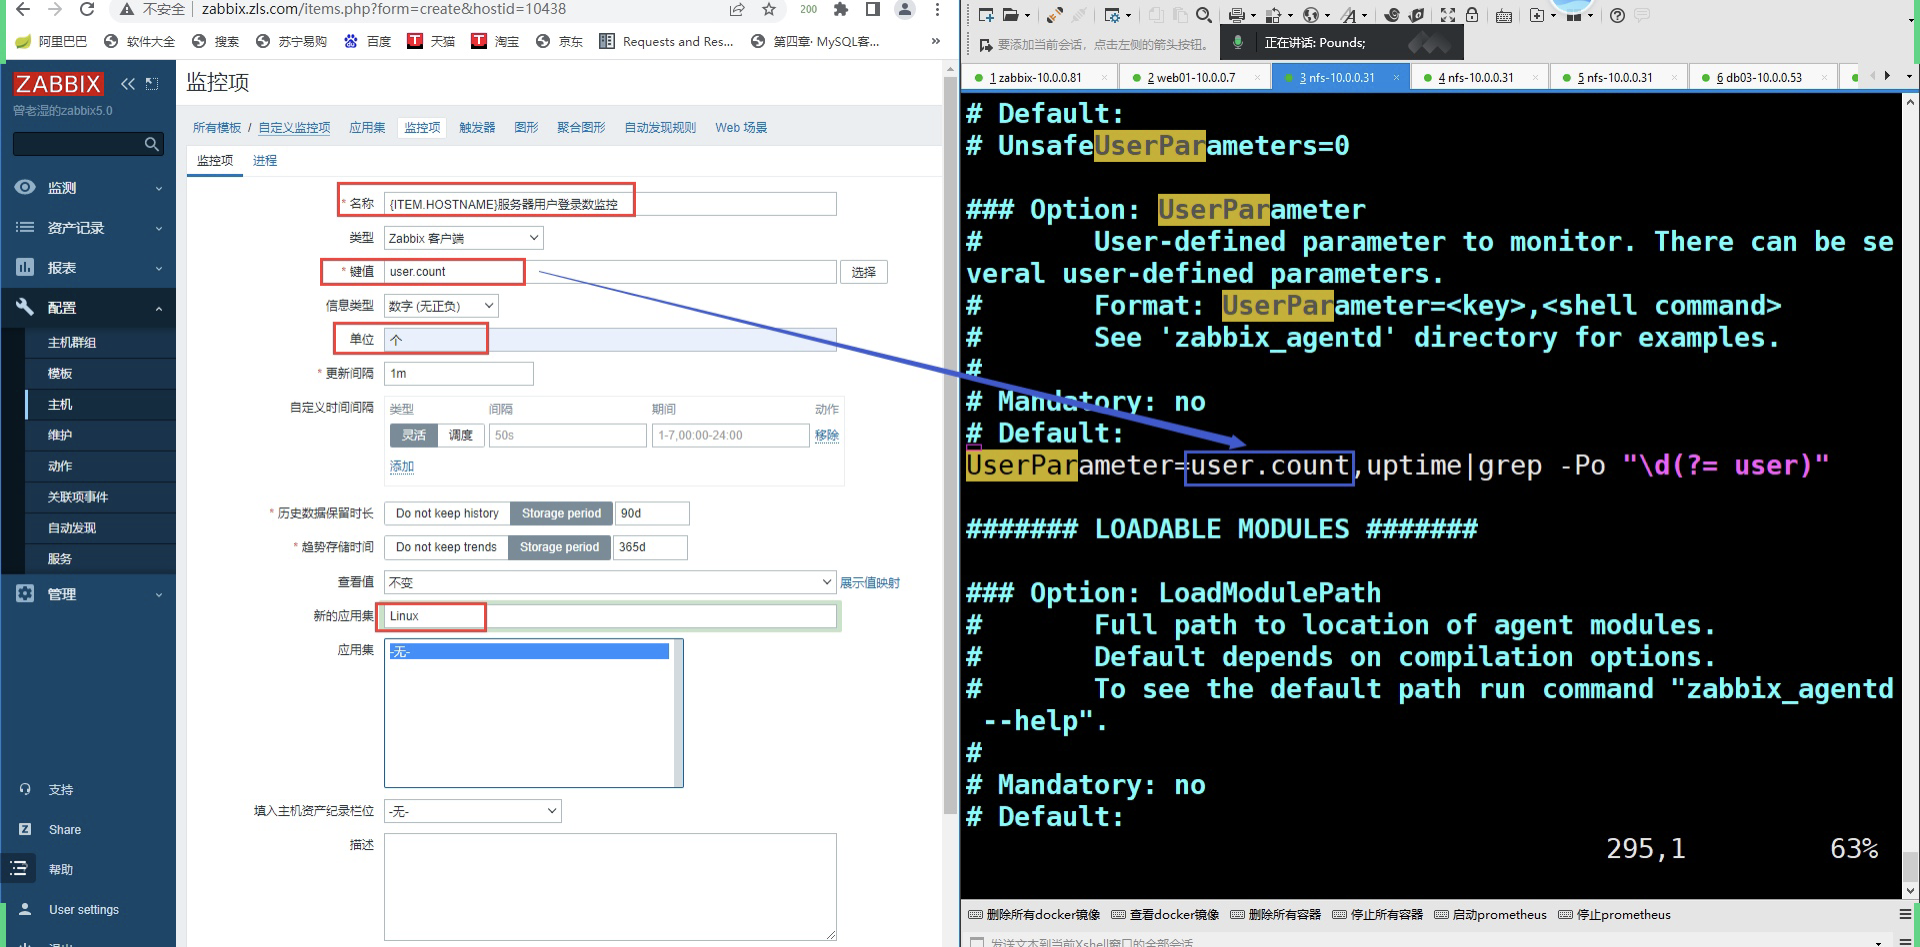
自定义监控项的格式 1 2 3 4 5 6 7 UserParameter=监控项的key名称,获取监控项值的命令或脚本 UserParameter=<key>,<shell command > UserParameter=user.count,who | wc -l 或 UserParameter=user.count,uptime|grep -Po "\d(?= user)"
添加配置文件 1 2 3 4 5 6 7 8 9 10 11 [root@web01 ~] UserParameter=user.count,who | wc -l [root@web01 ~] [root@web01 ~] [root@web01 ~] 3
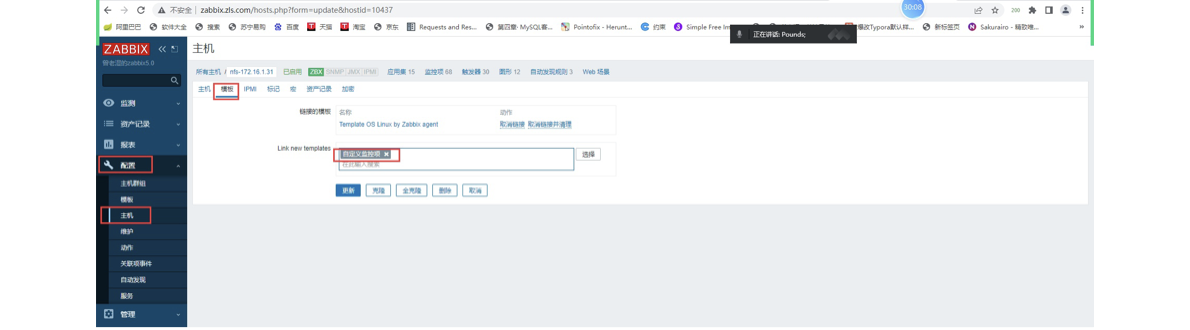
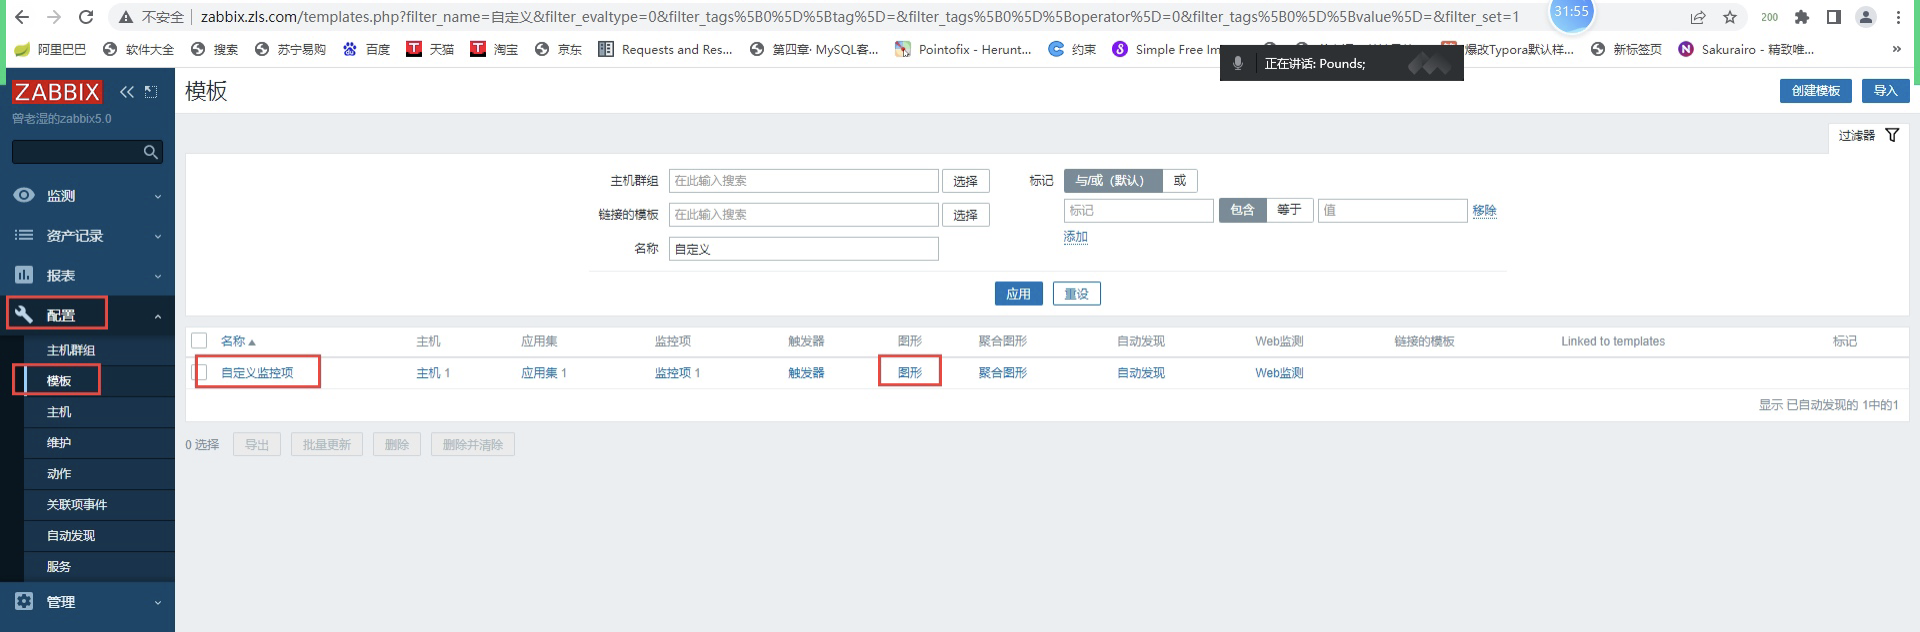
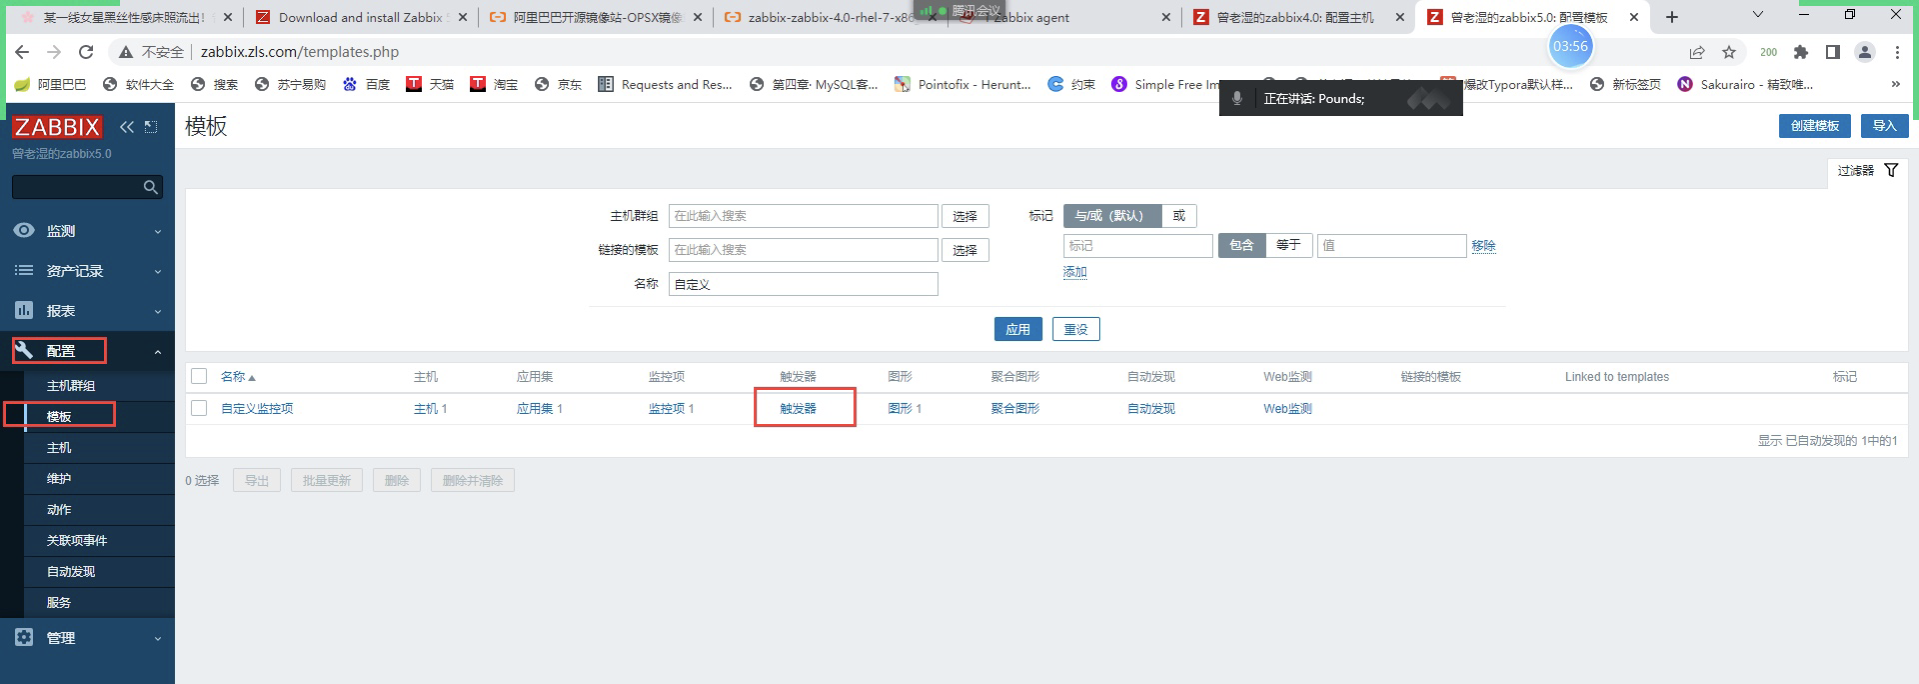
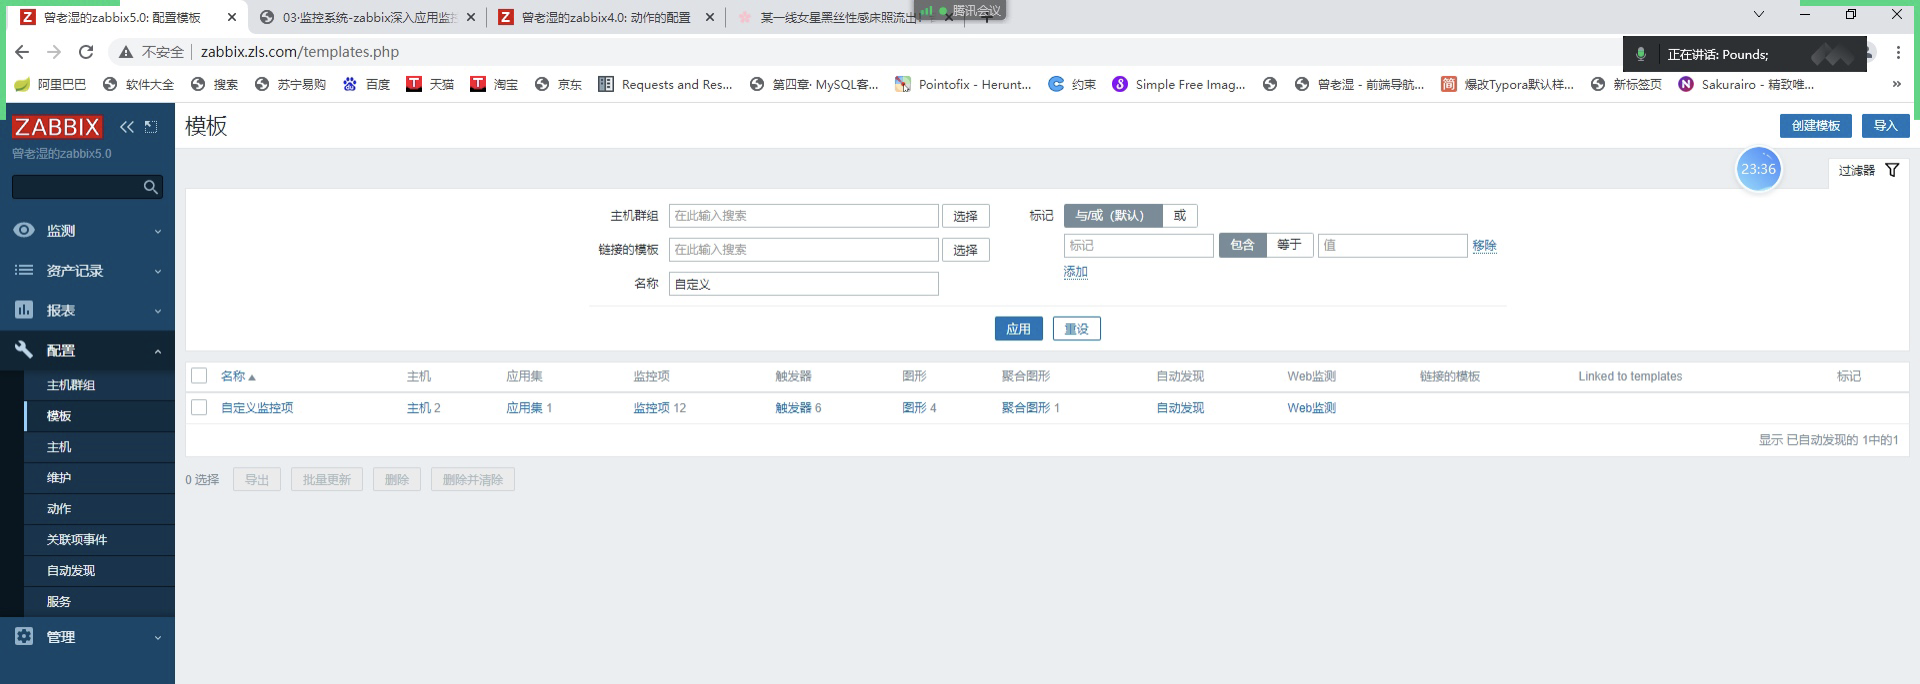
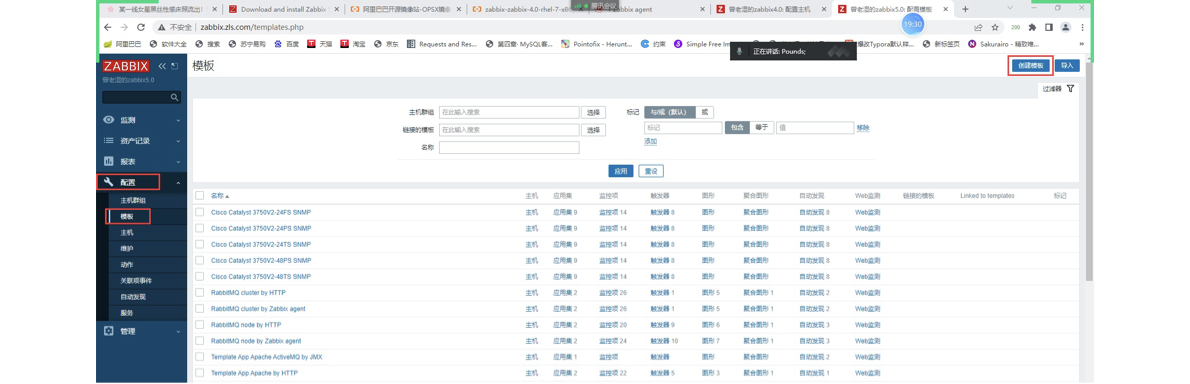
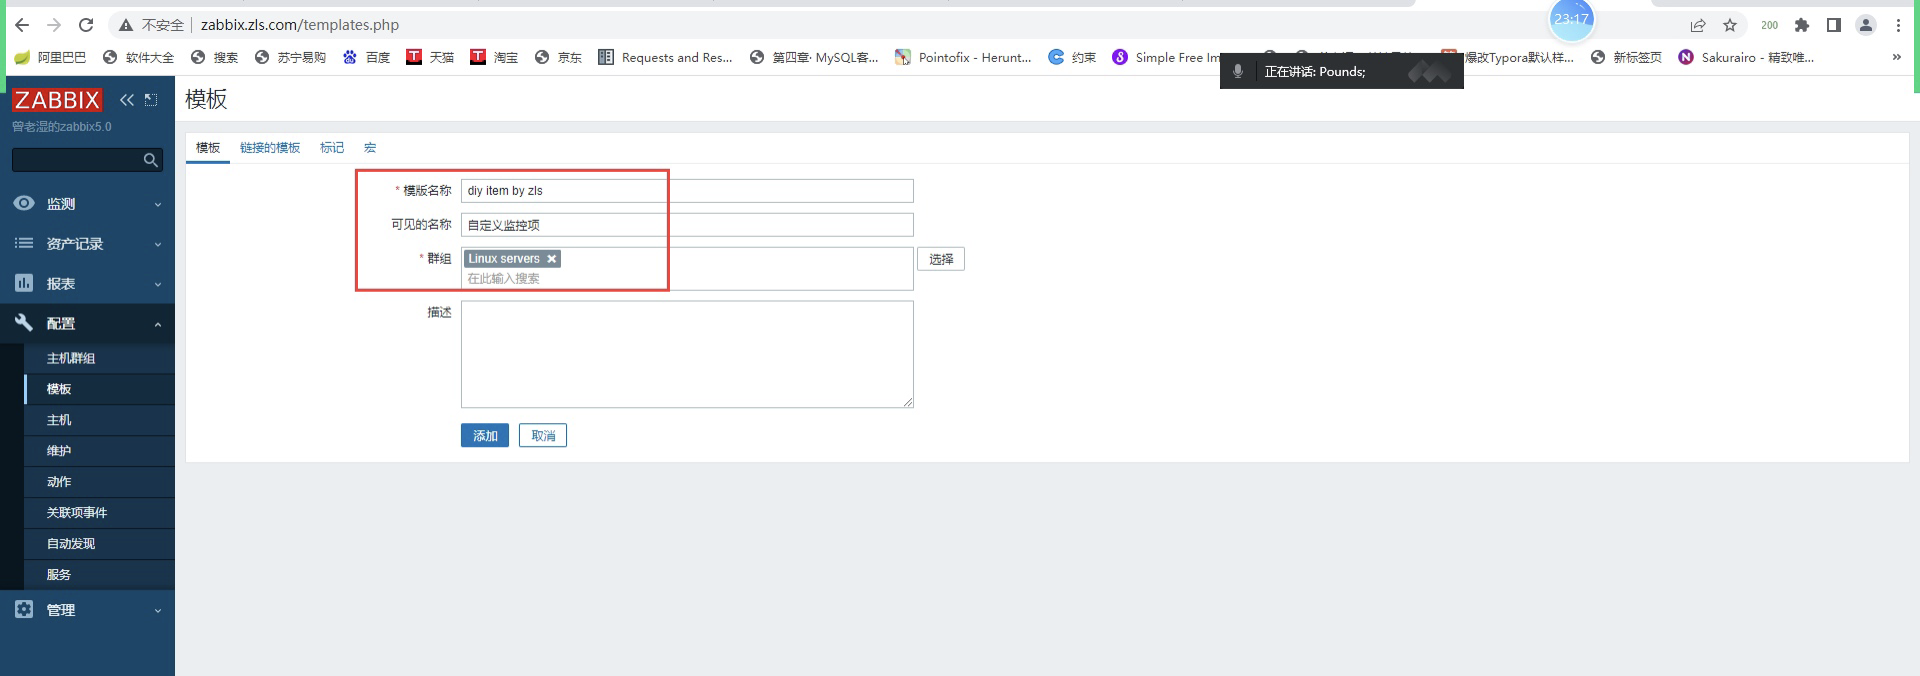
页面添加监控项 自己创建一个监控模板
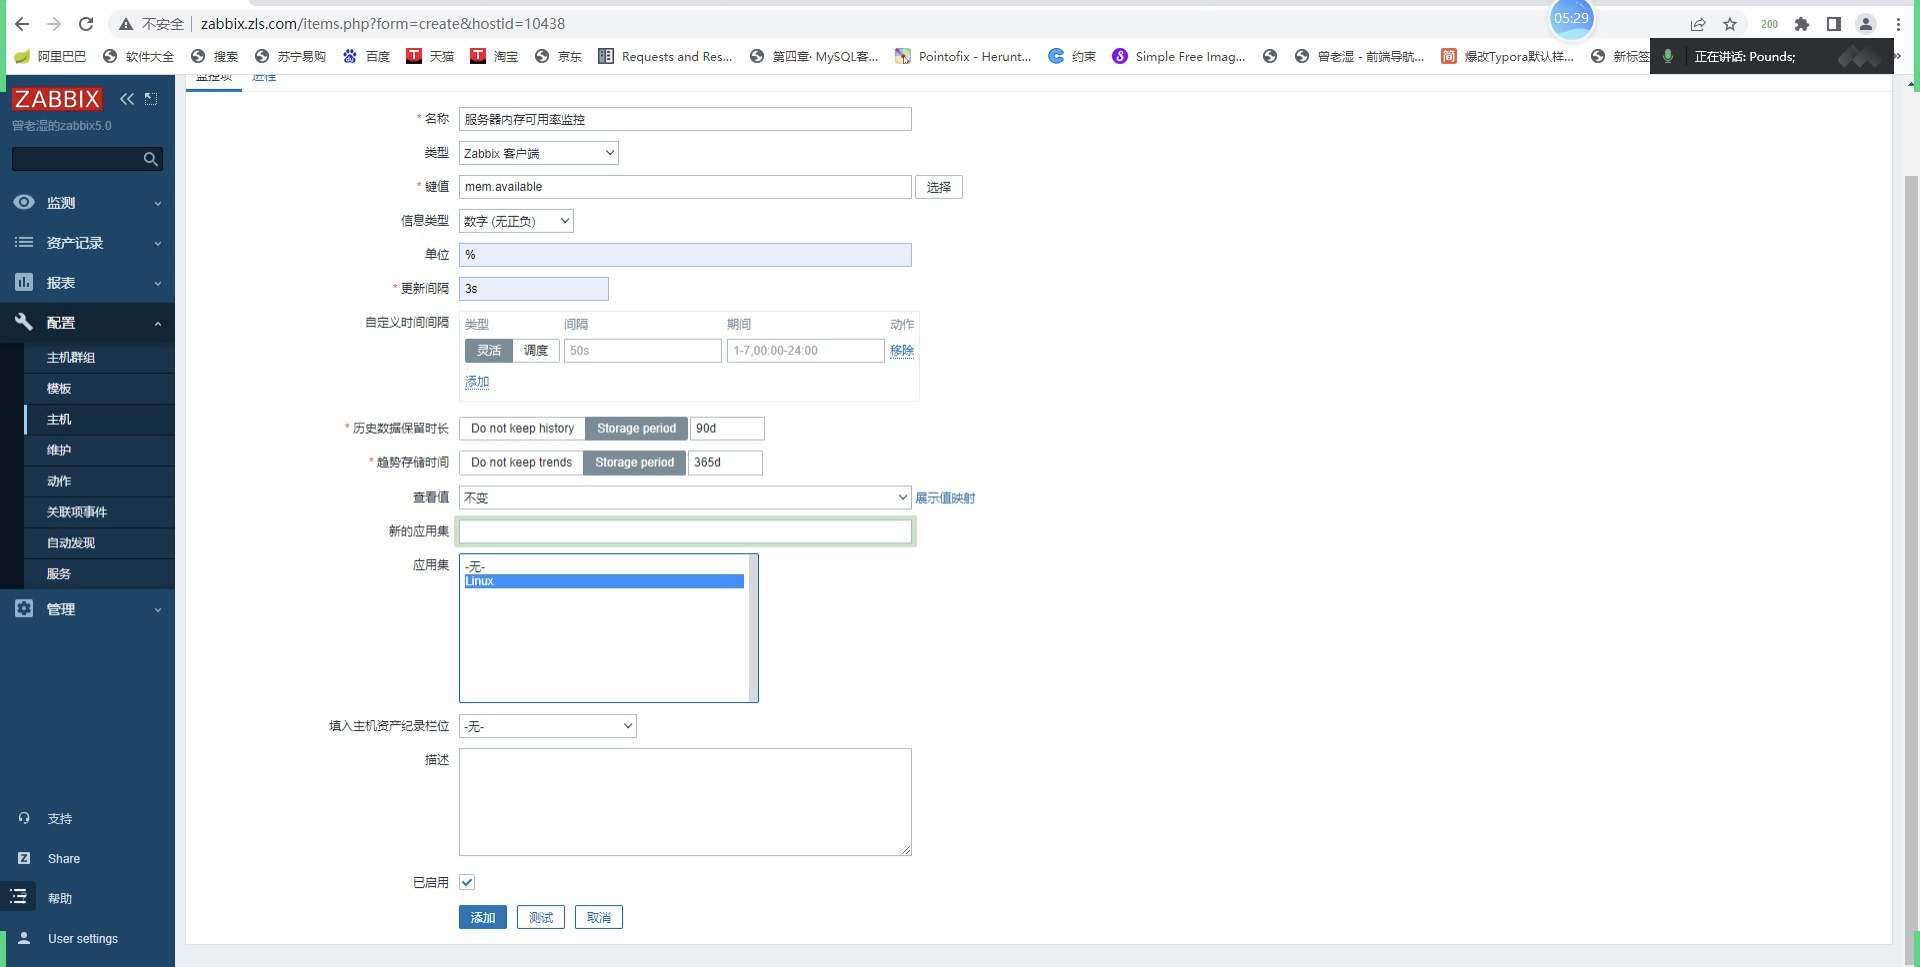
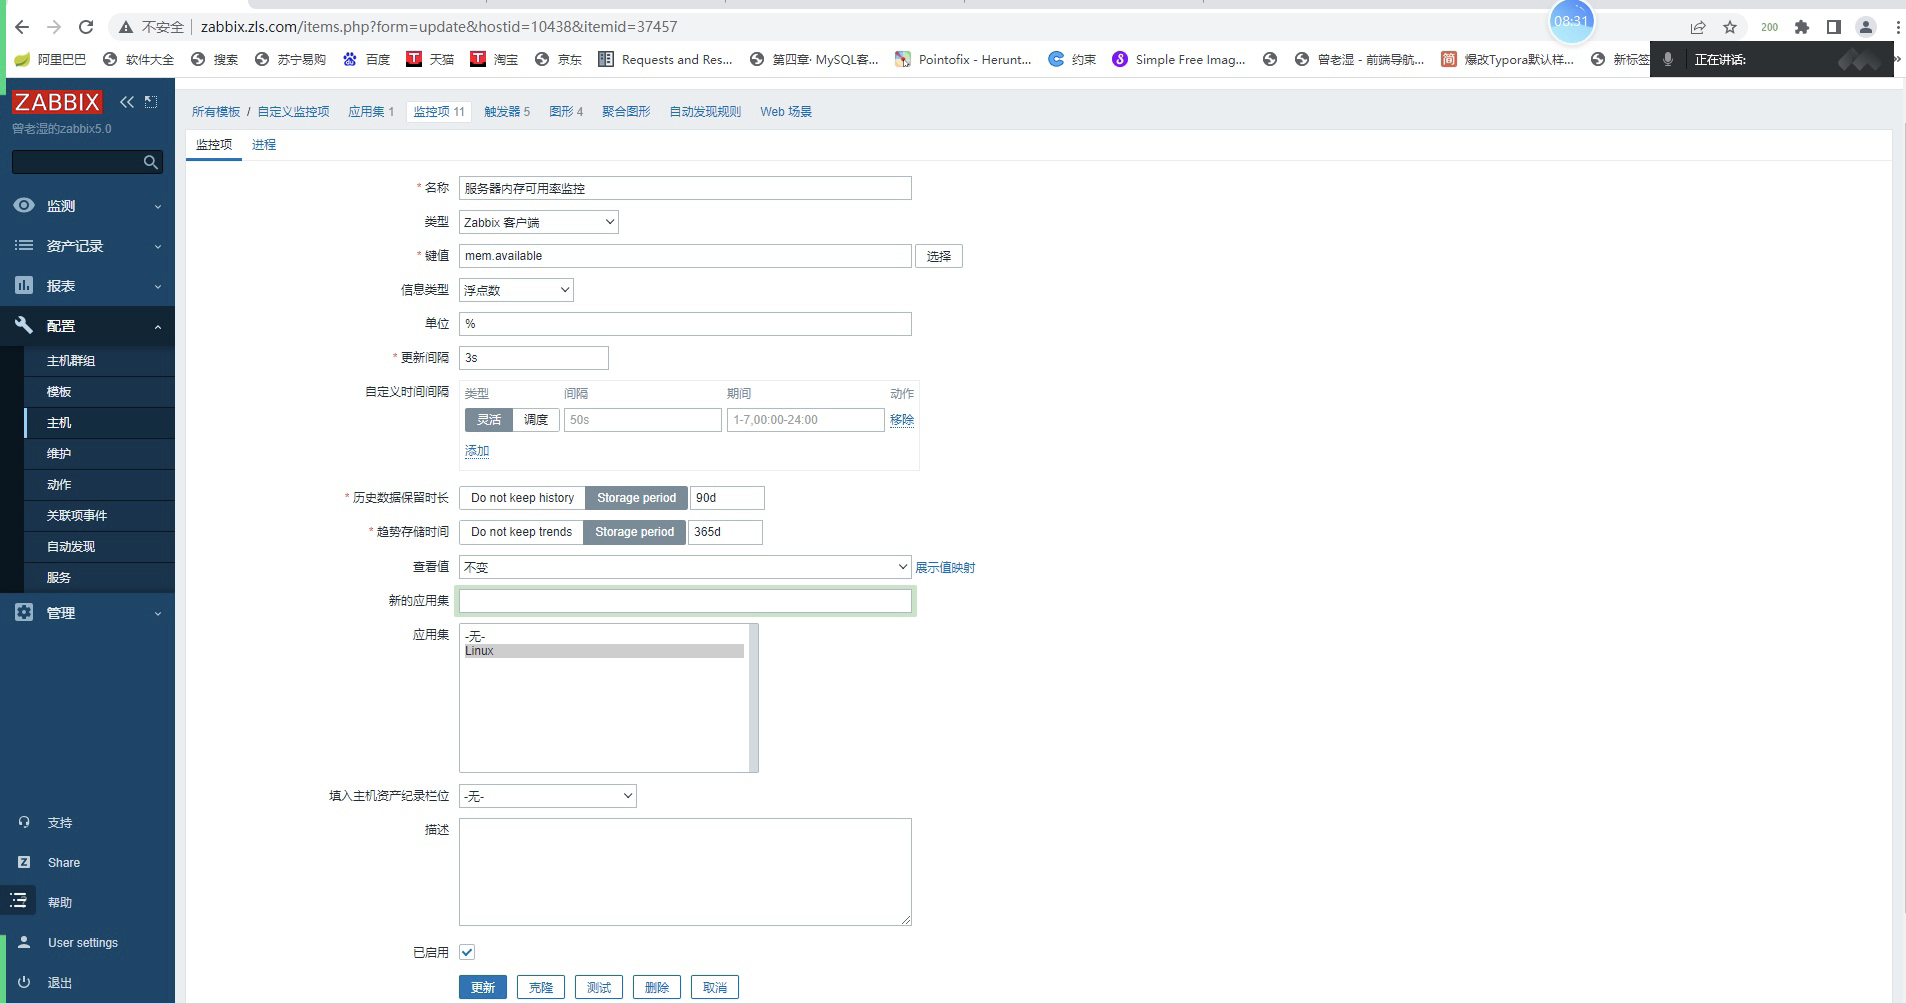
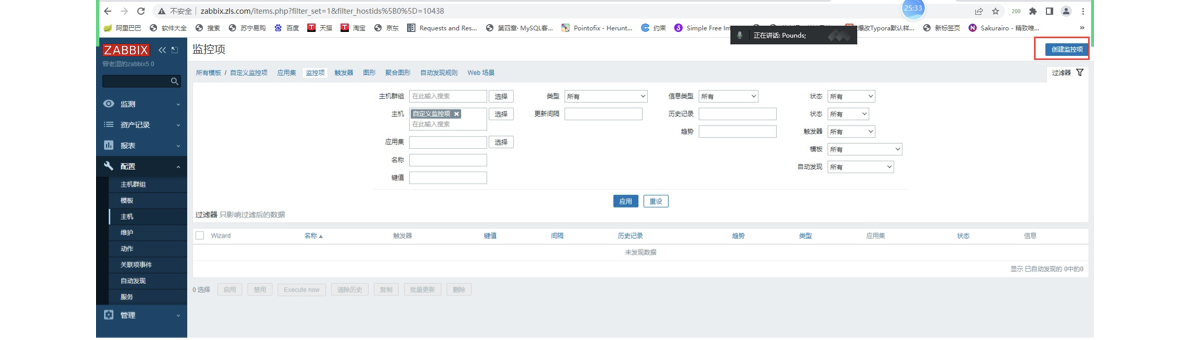
给模板中添加监控项
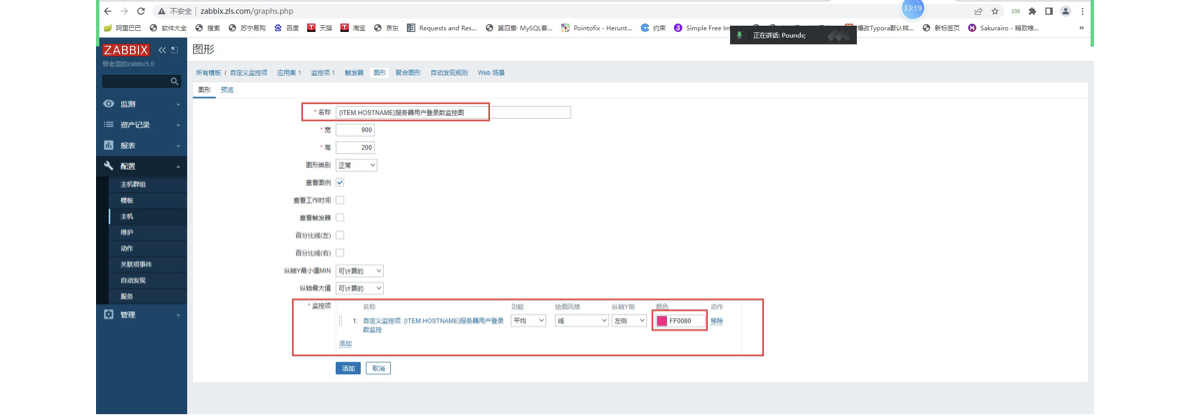
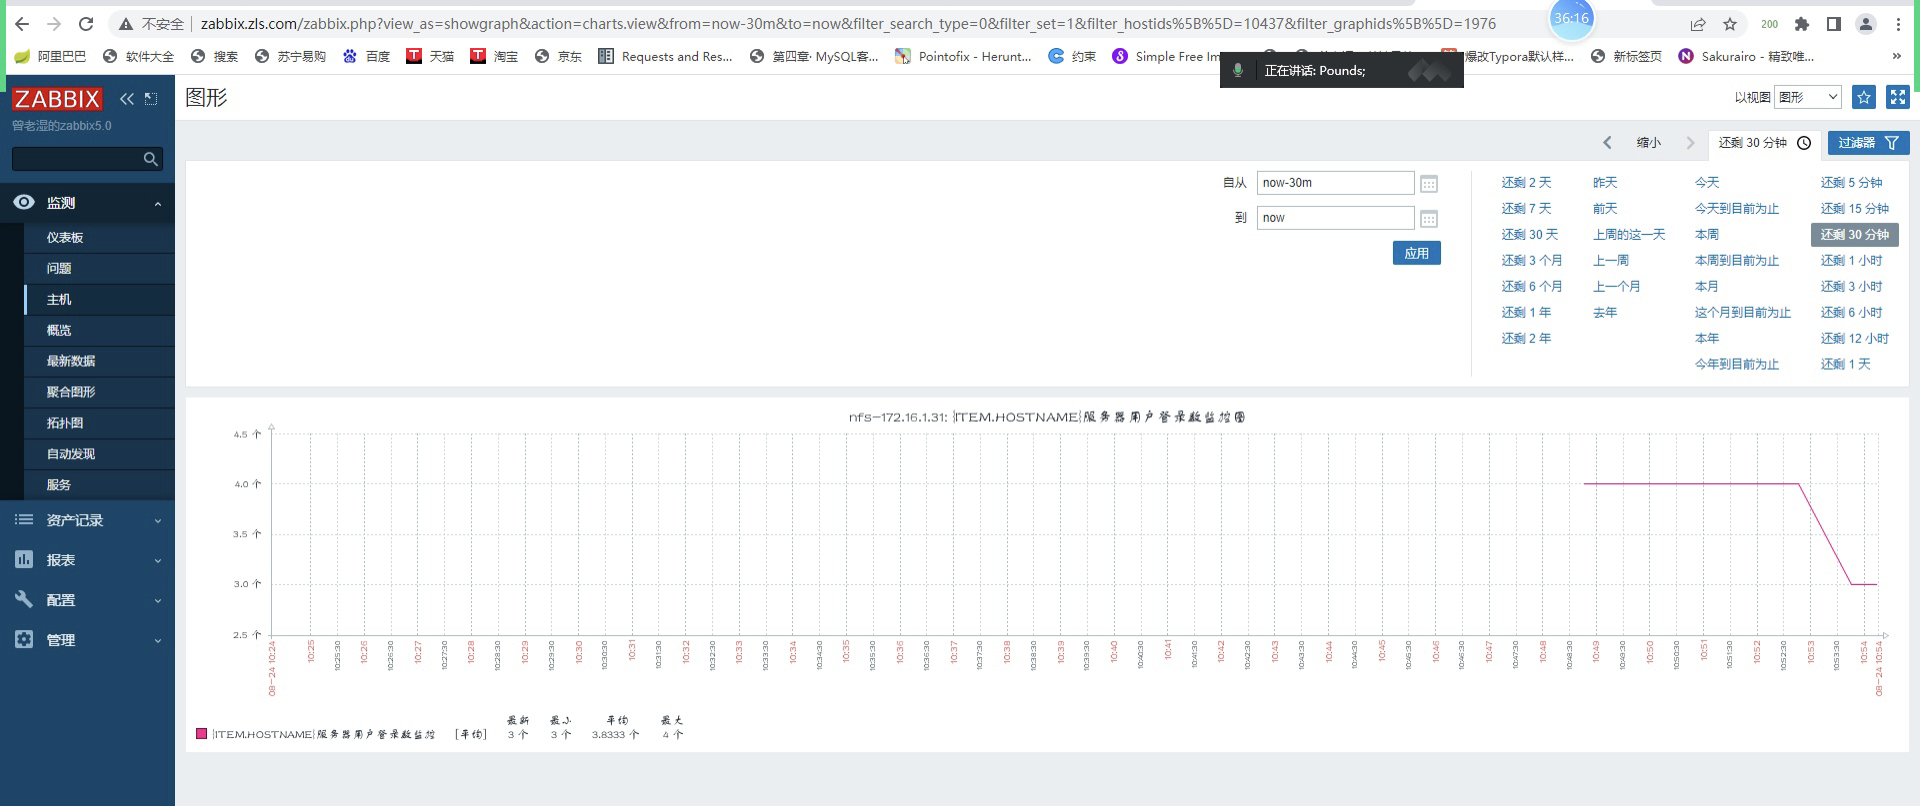
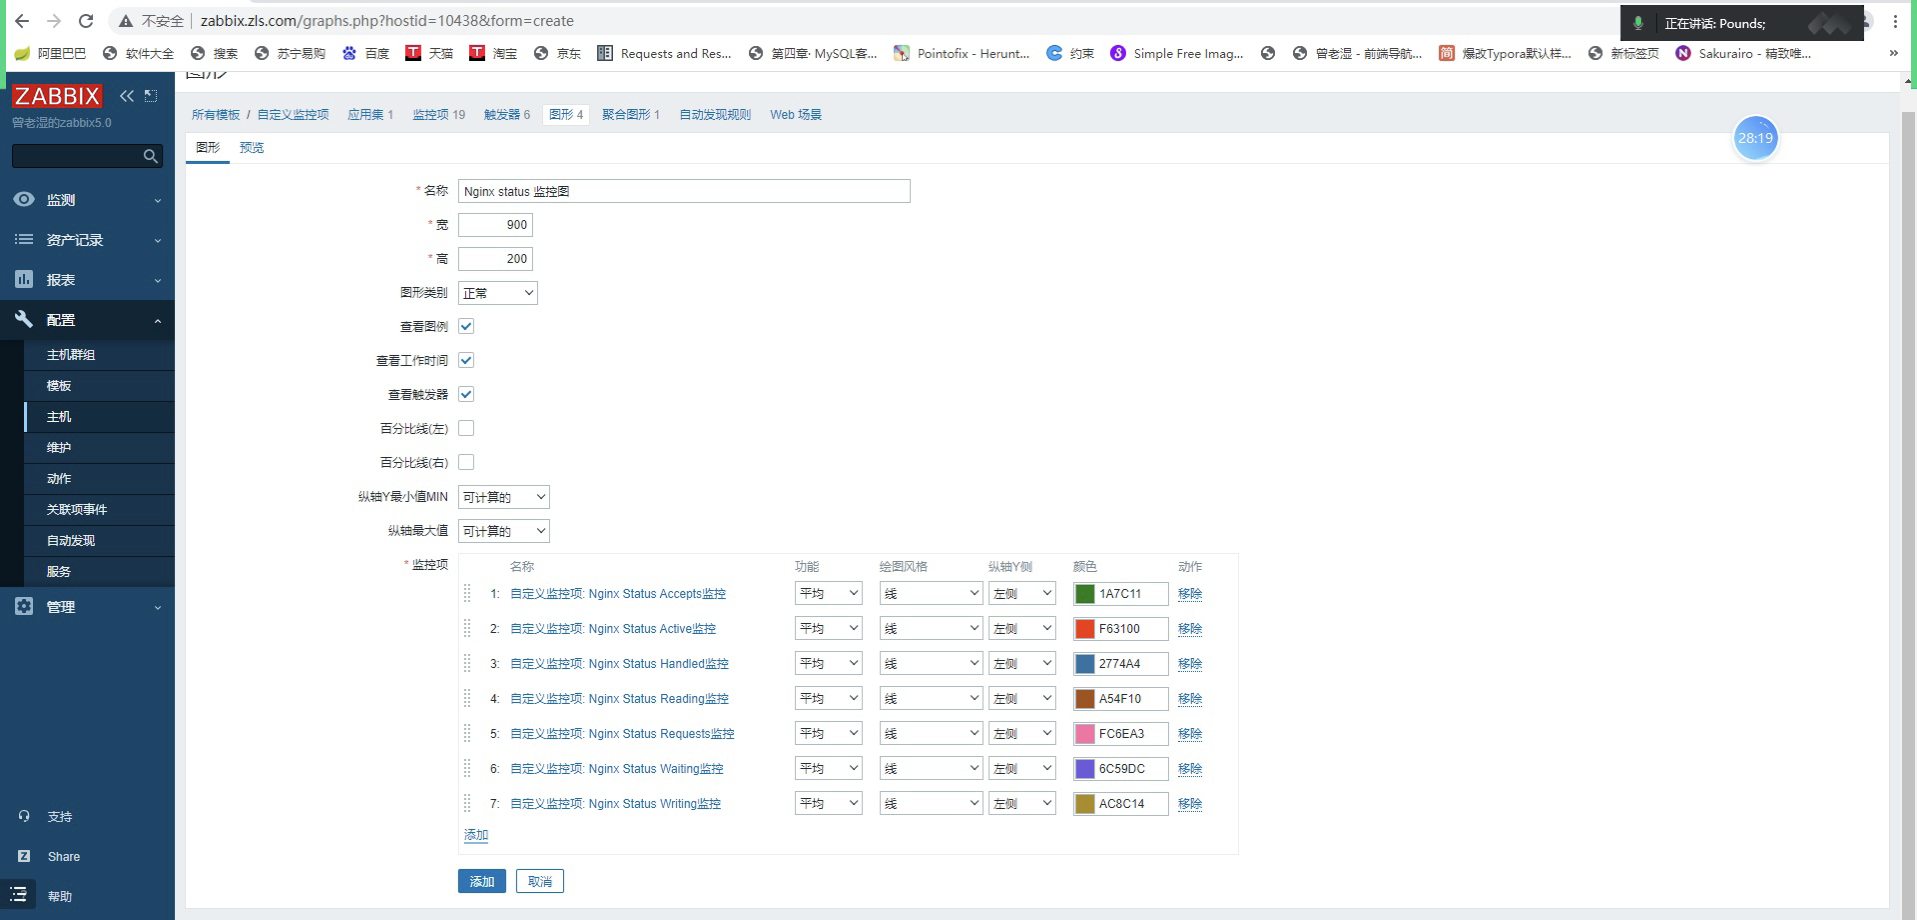
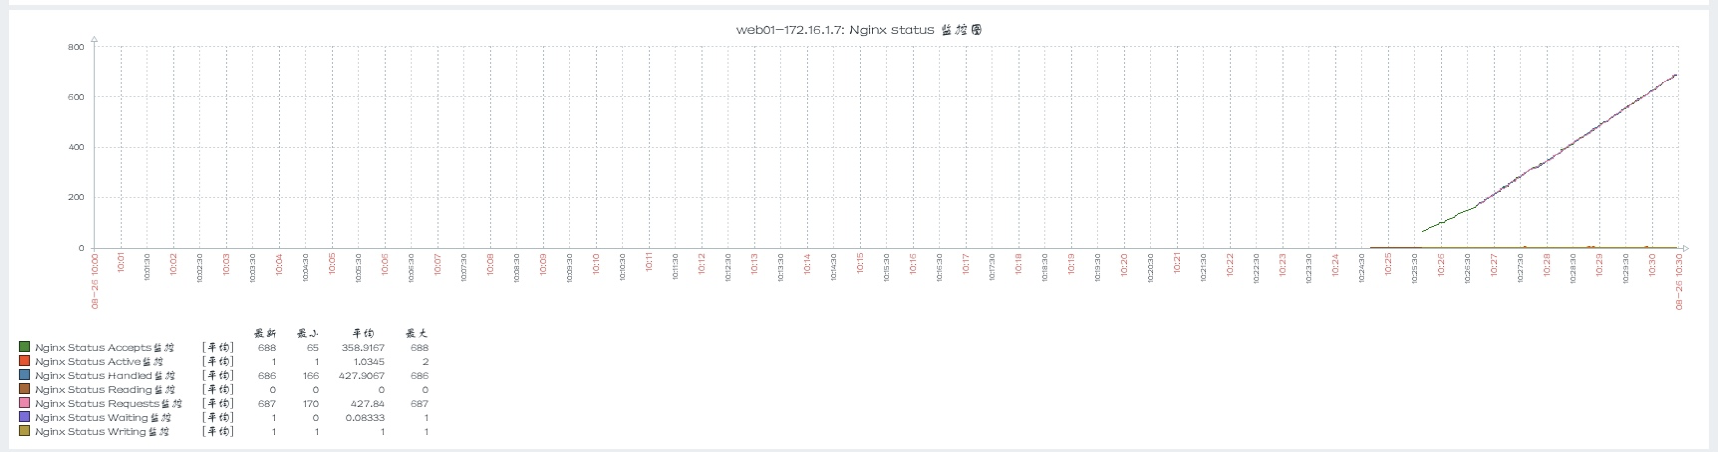
给监控项画图
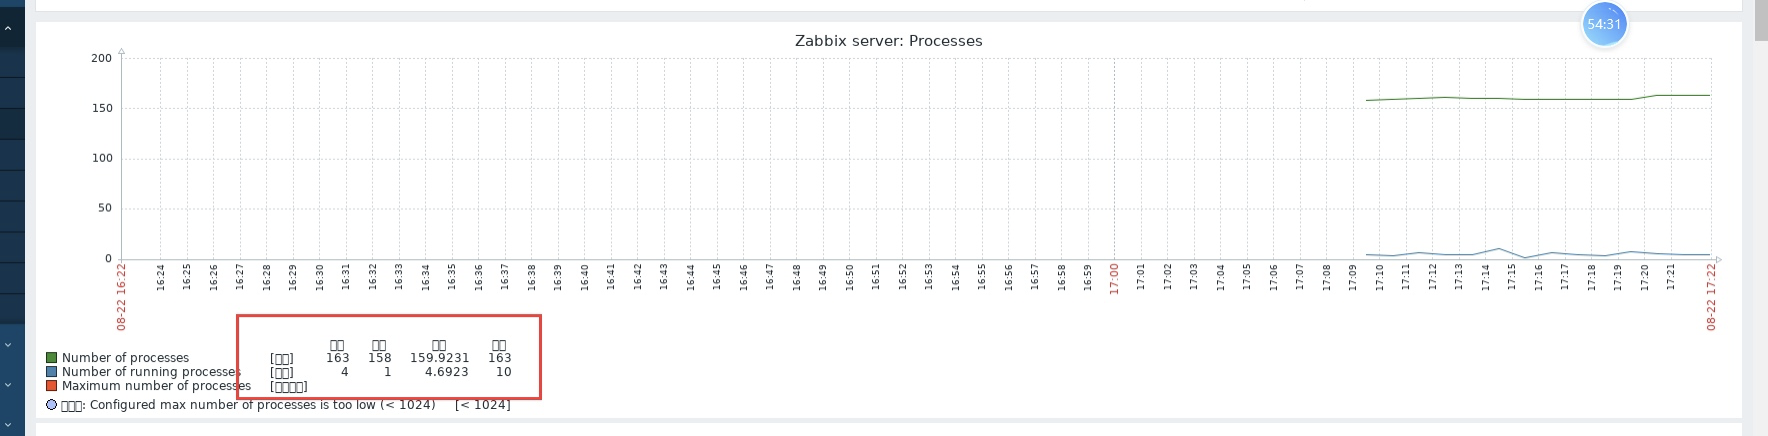
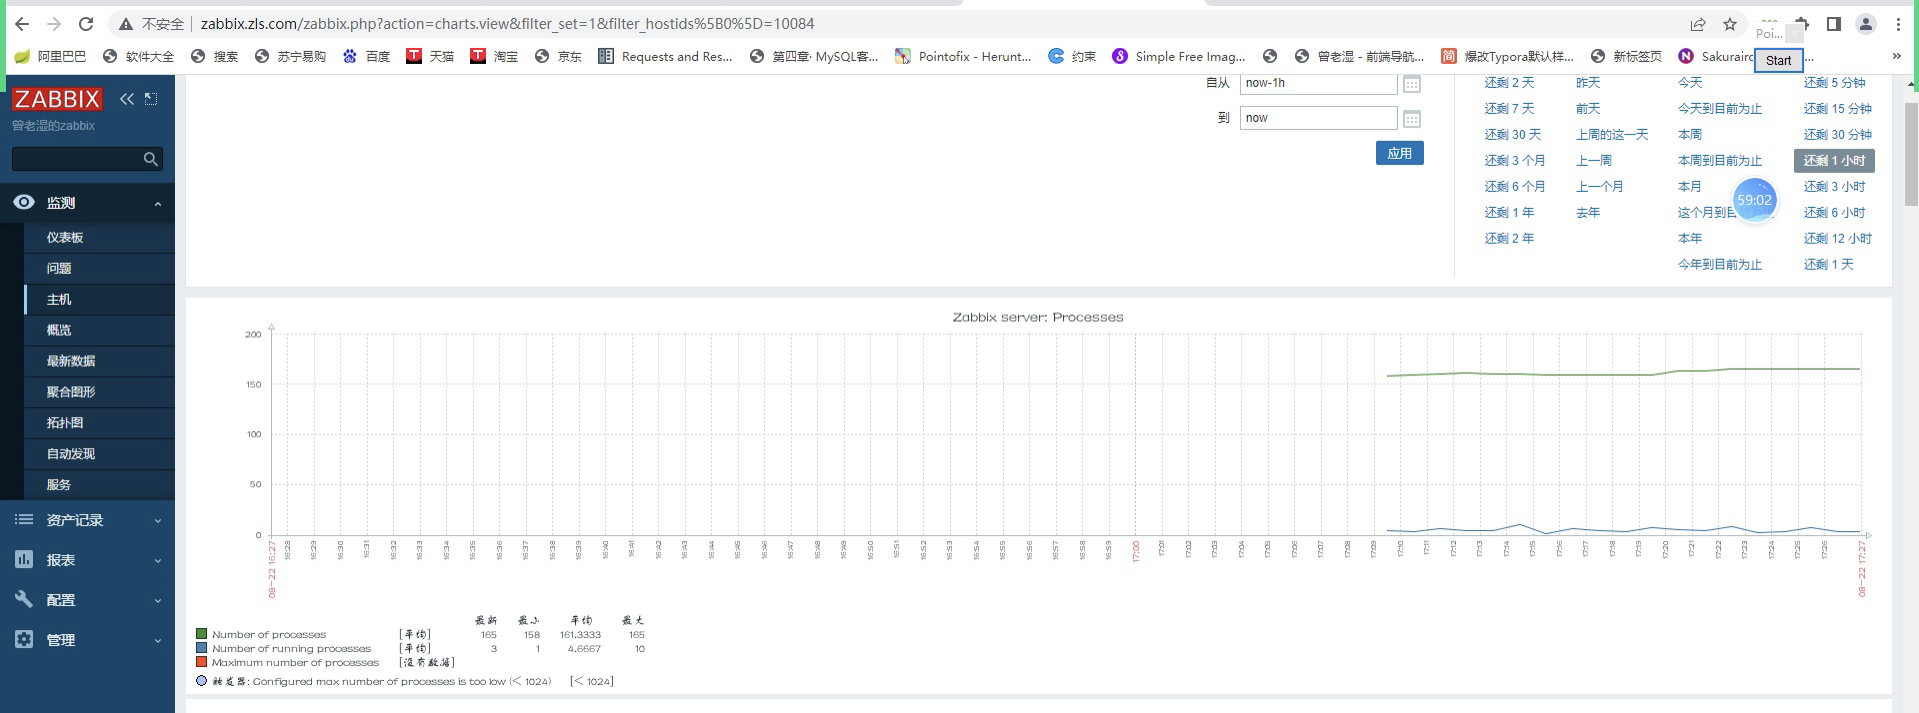
查看监控数据
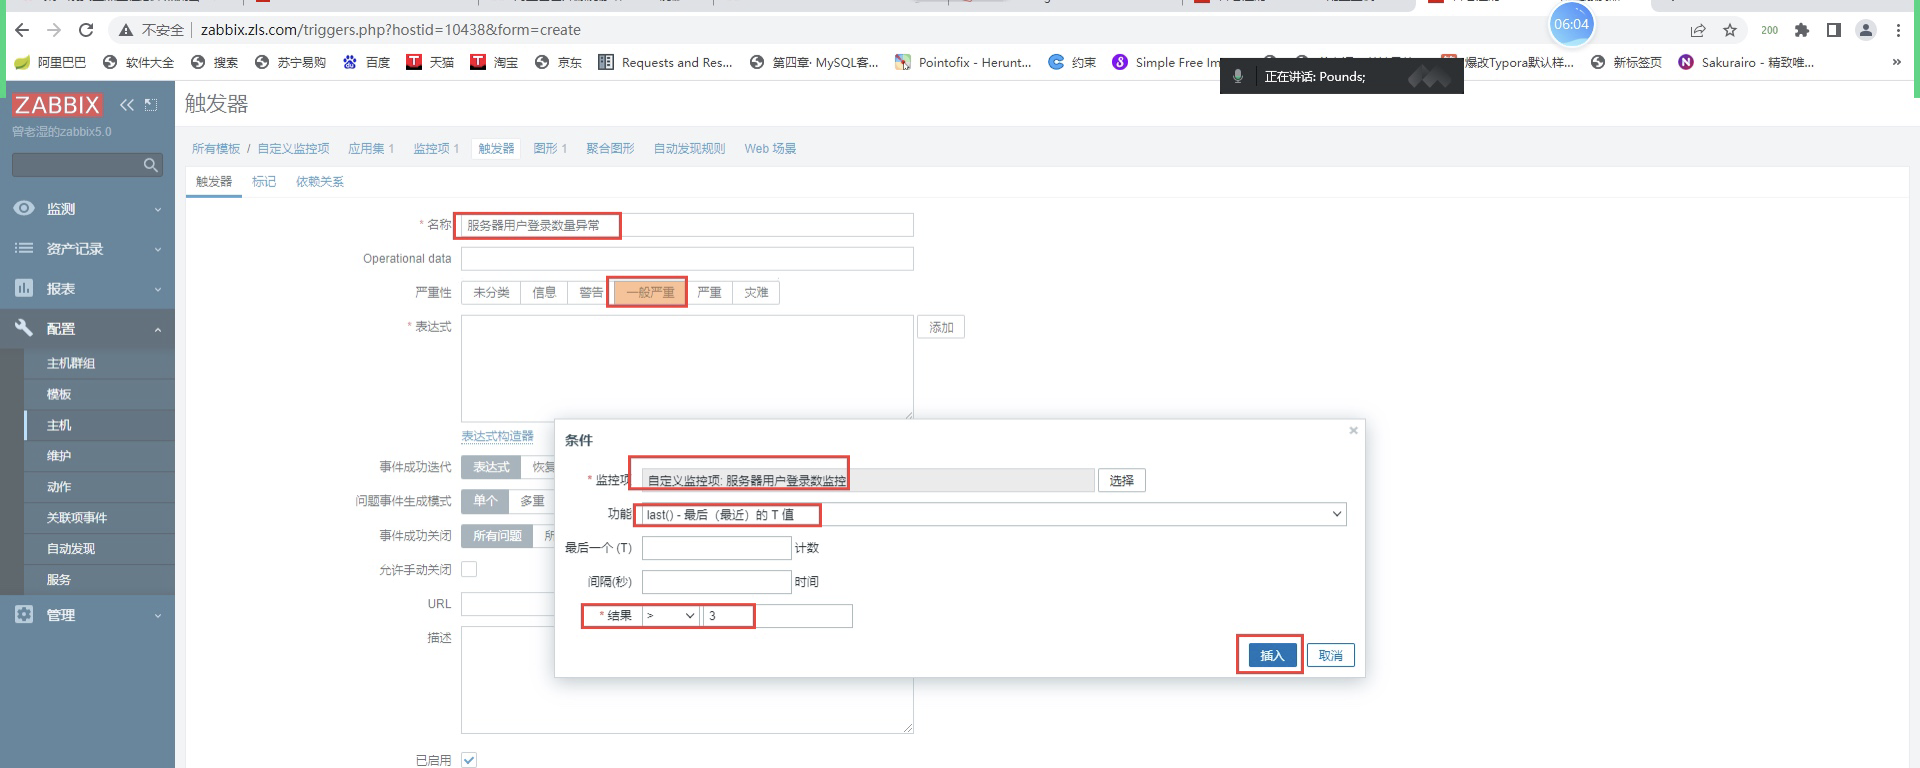
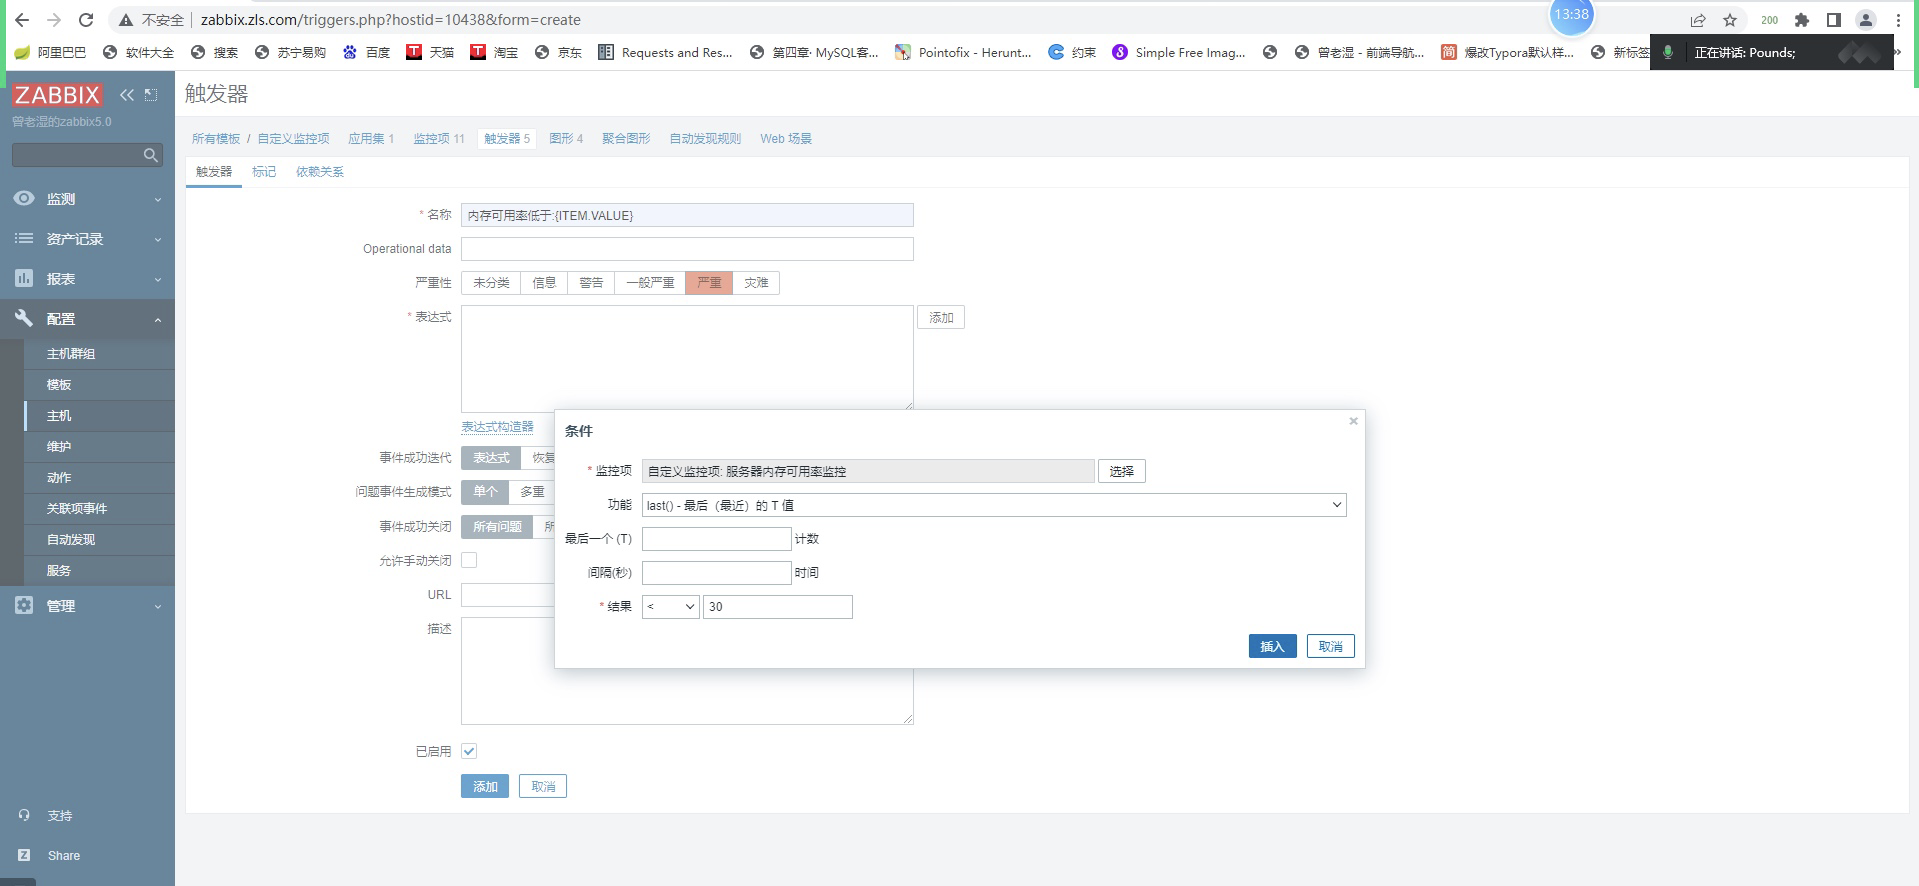
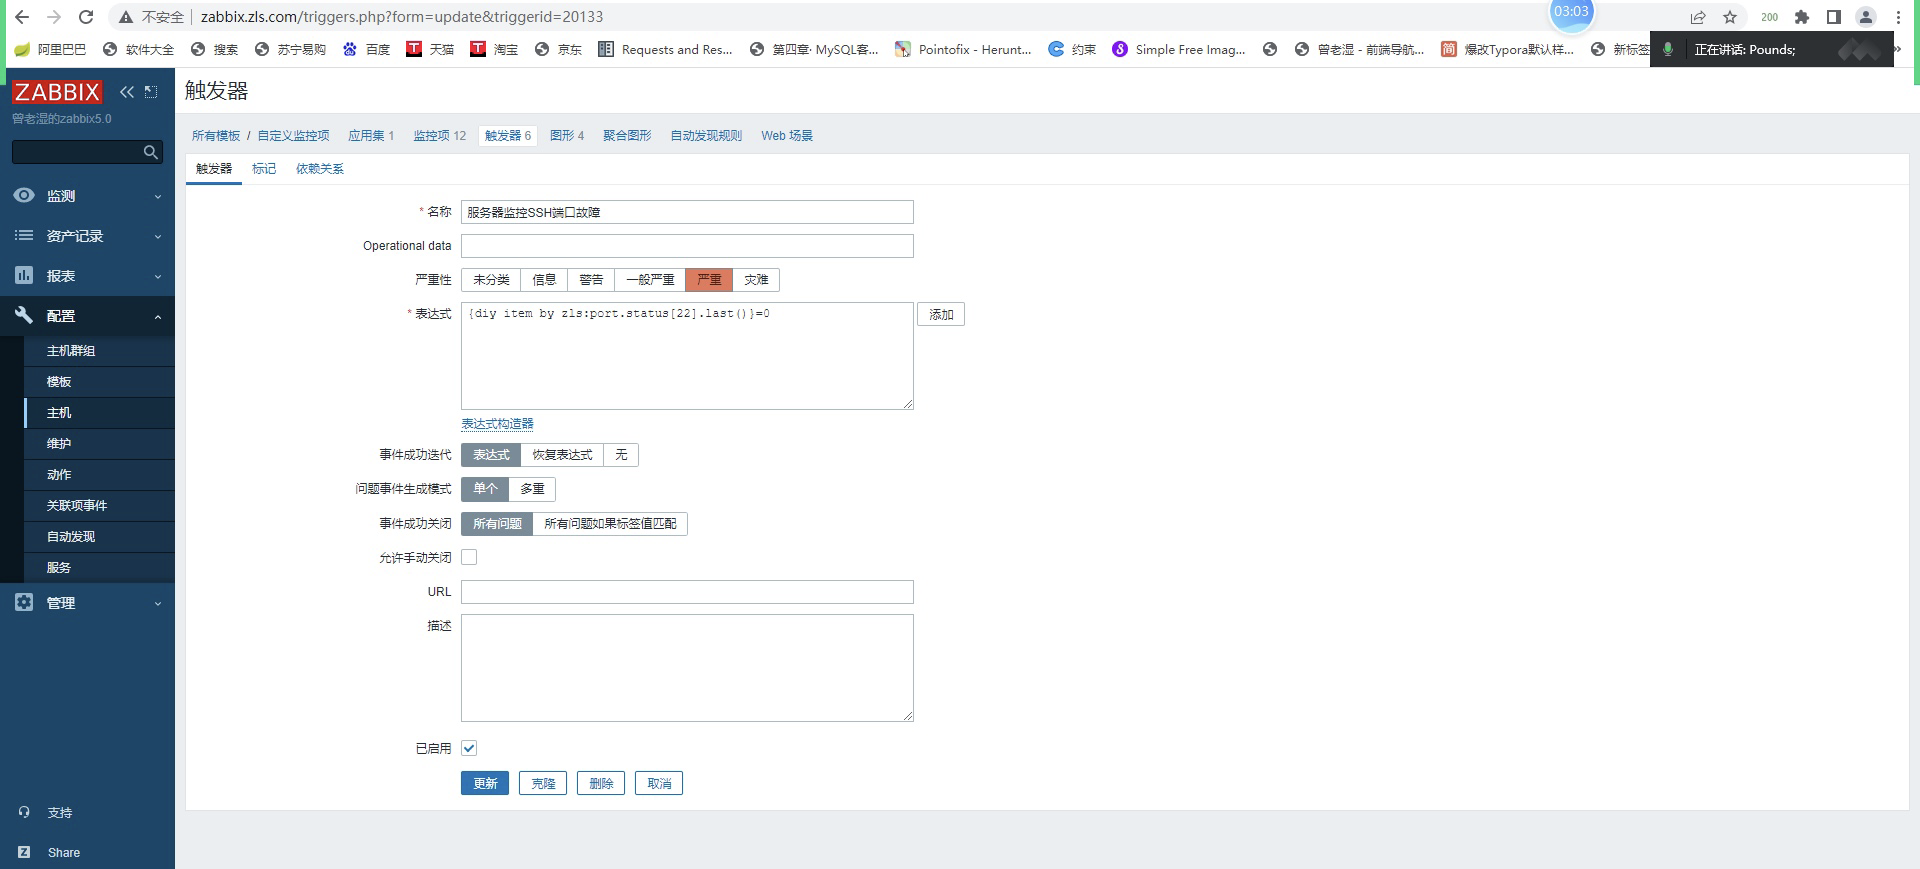
给监控项添加触发器 常用触发器
1 2 3 4 5 6 7 8 and or last() avg() diff() nodata() (5m) (
优化页面告警 1 2 3 主机名:{HOST.NAME} IP地址:{HOST.IP} Monitor Login User Count Problem 主机名:{HOST.NAME} IP地址:{HOST.IP}
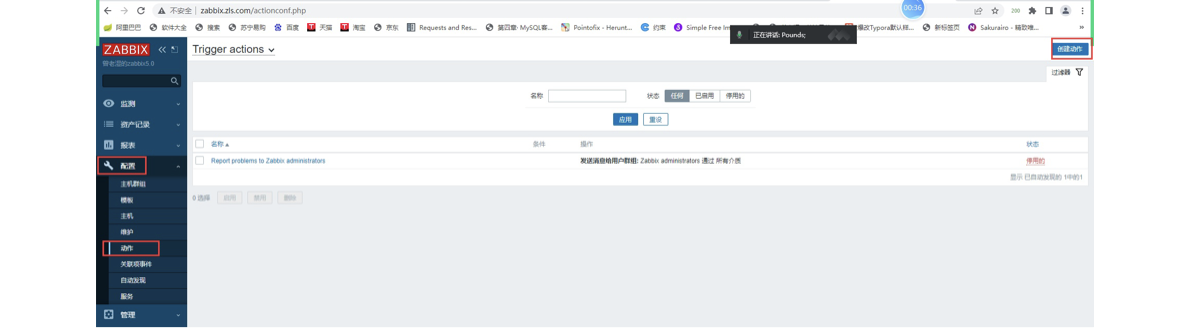
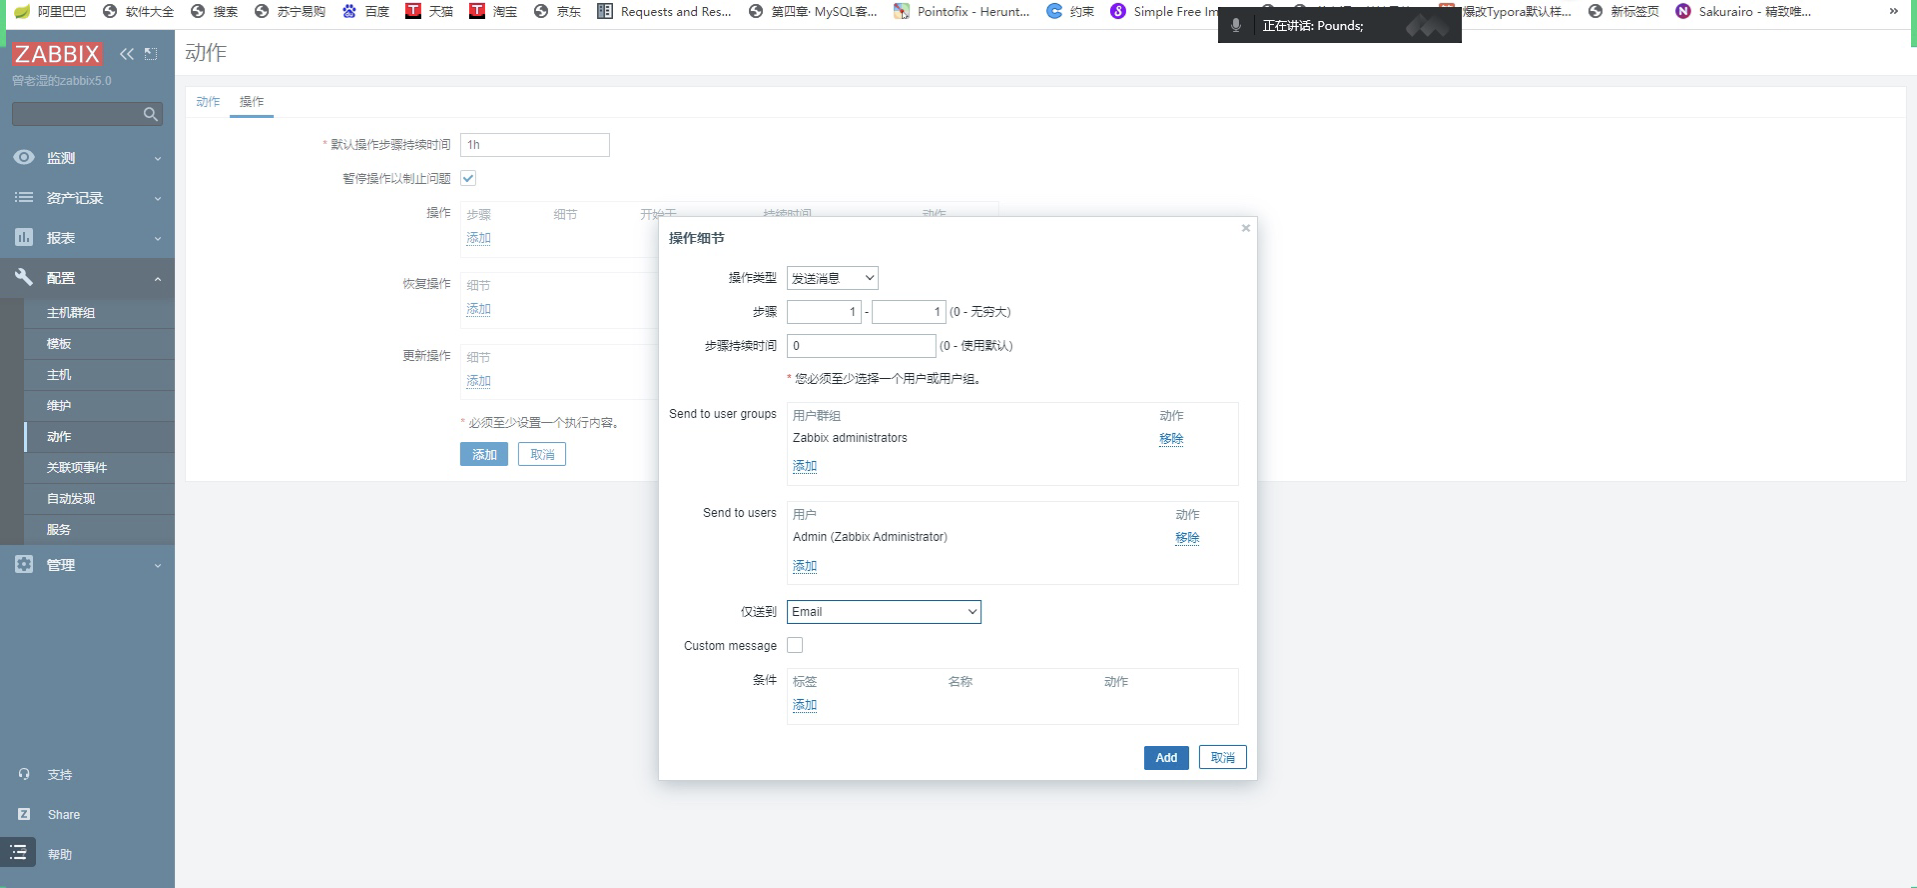
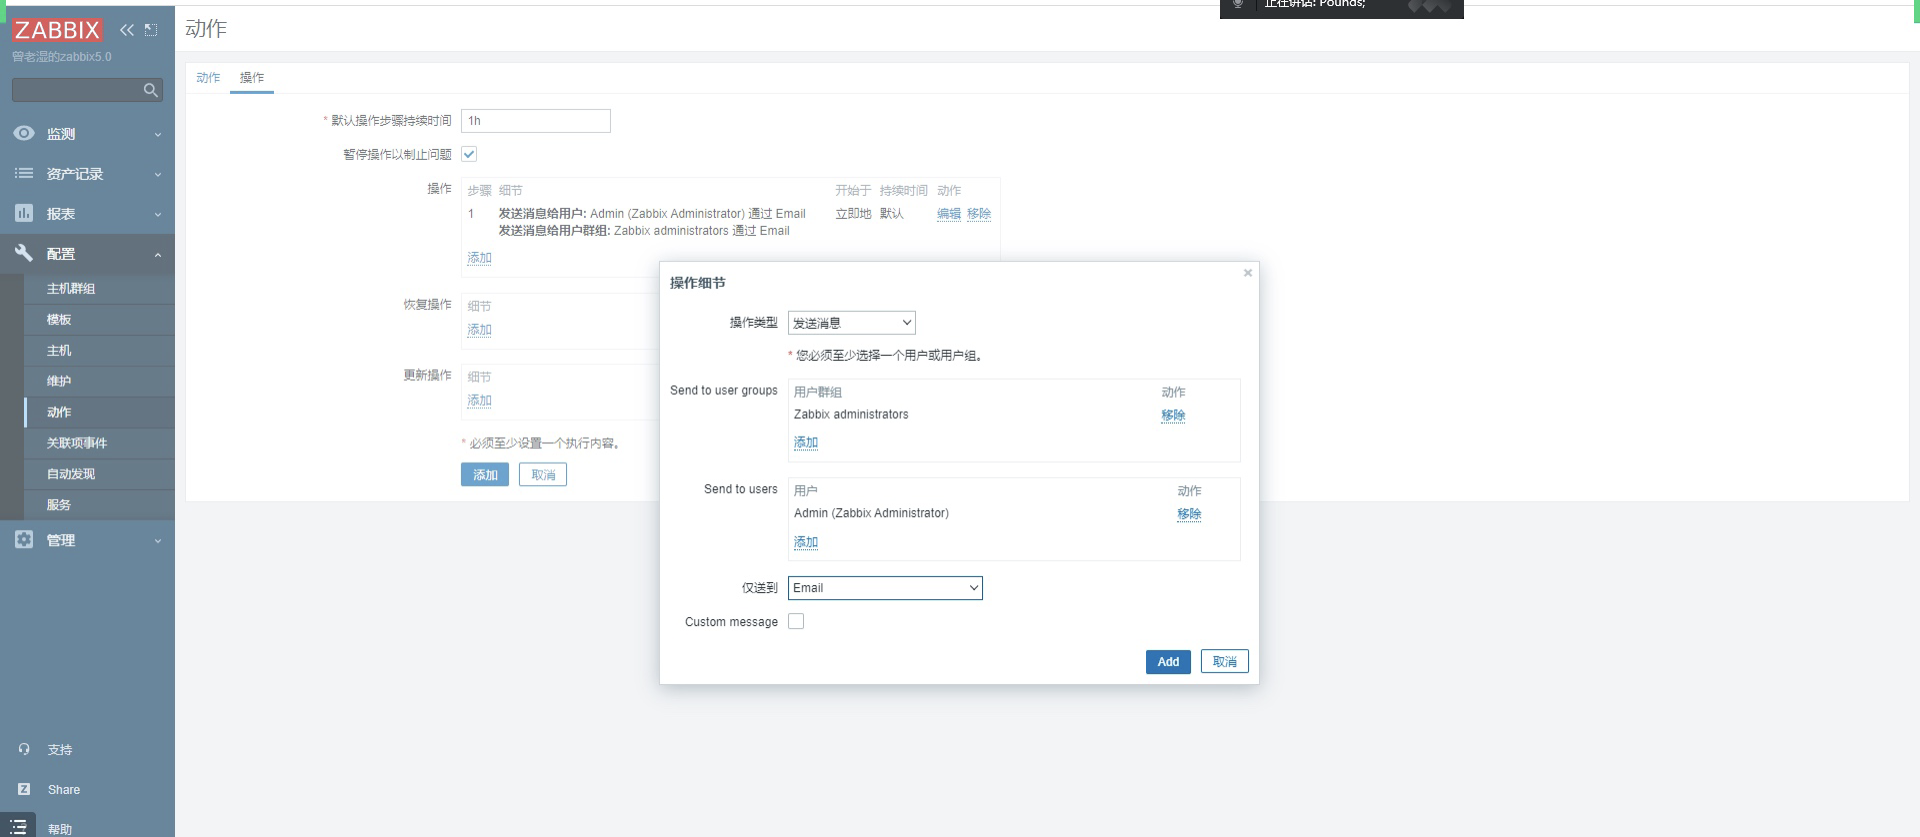
给监控项的触发器添加告警动作
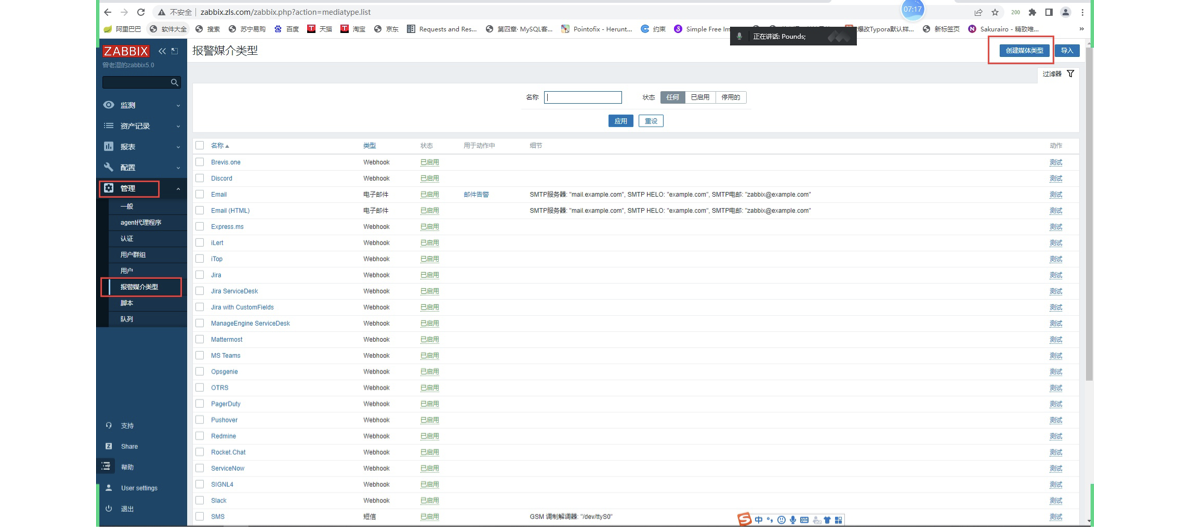
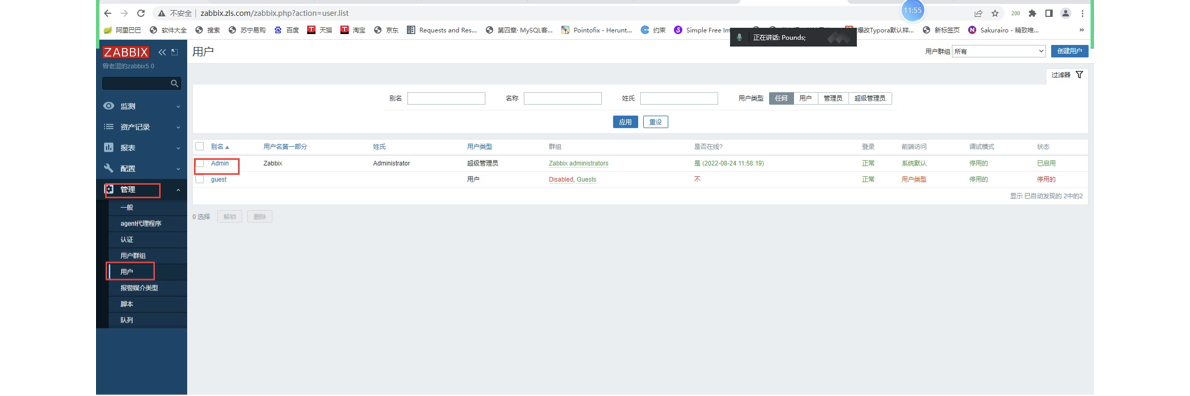
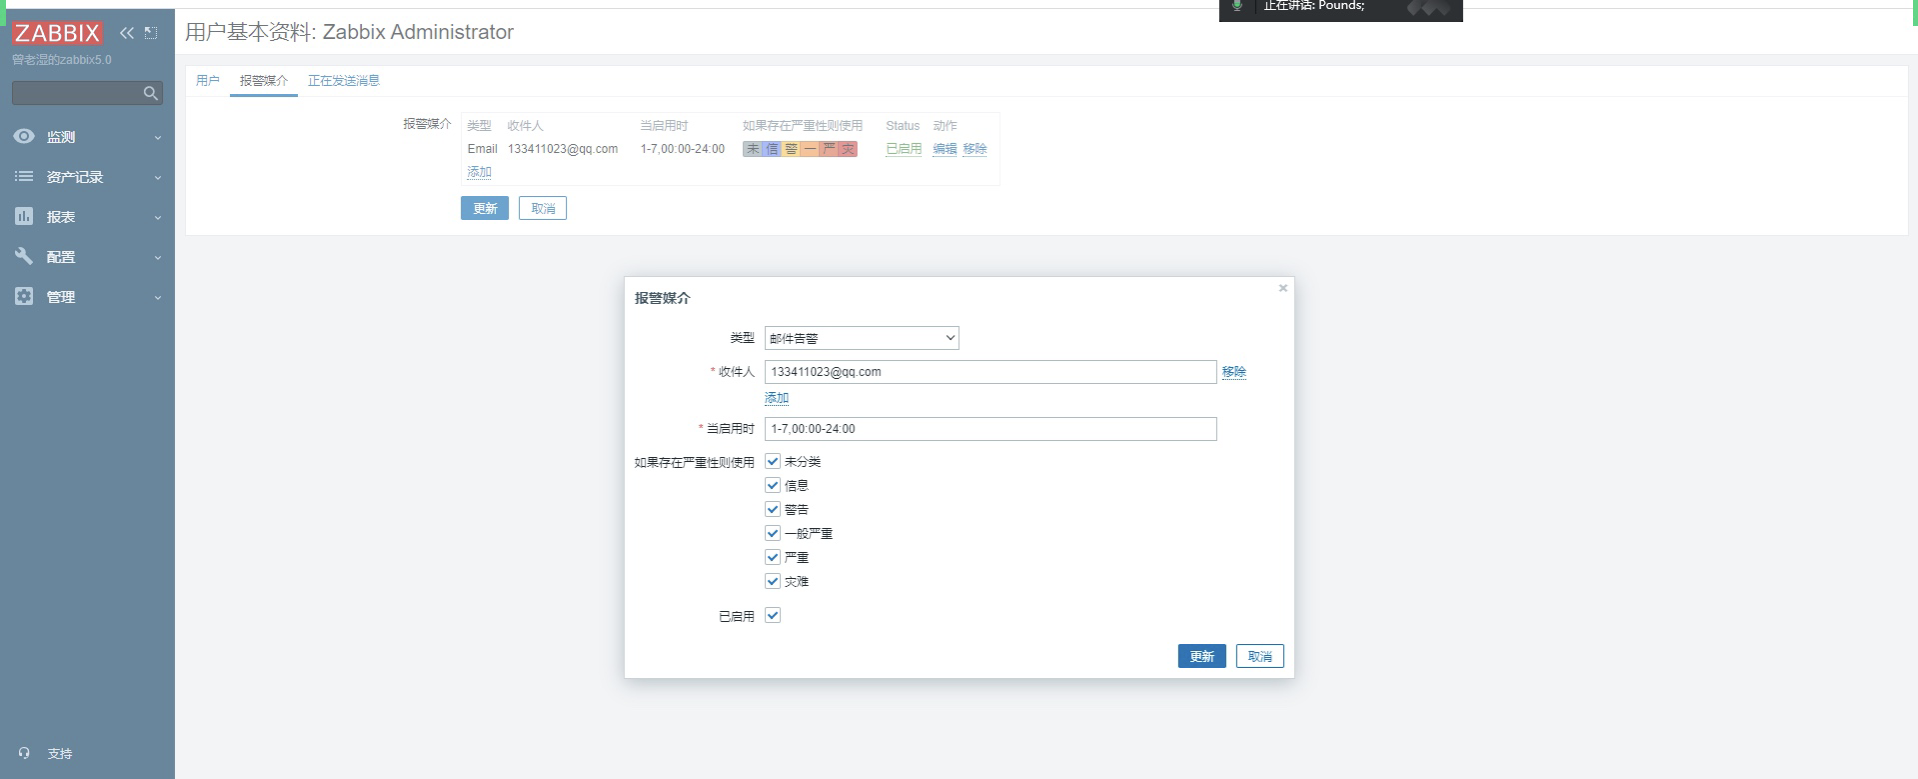
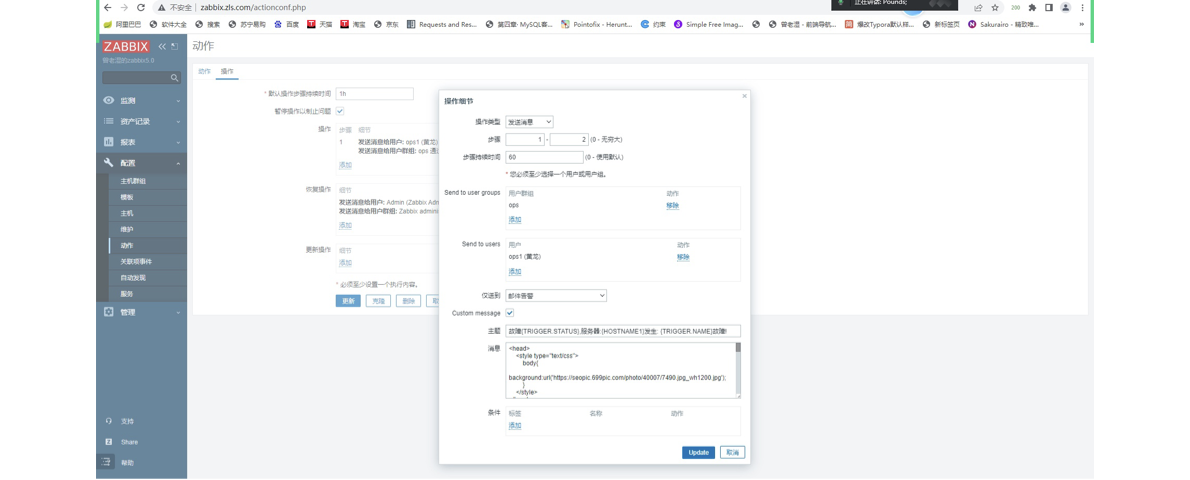
添加邮件告警(报警媒介类型:发件人和告警方式)
配置收件人
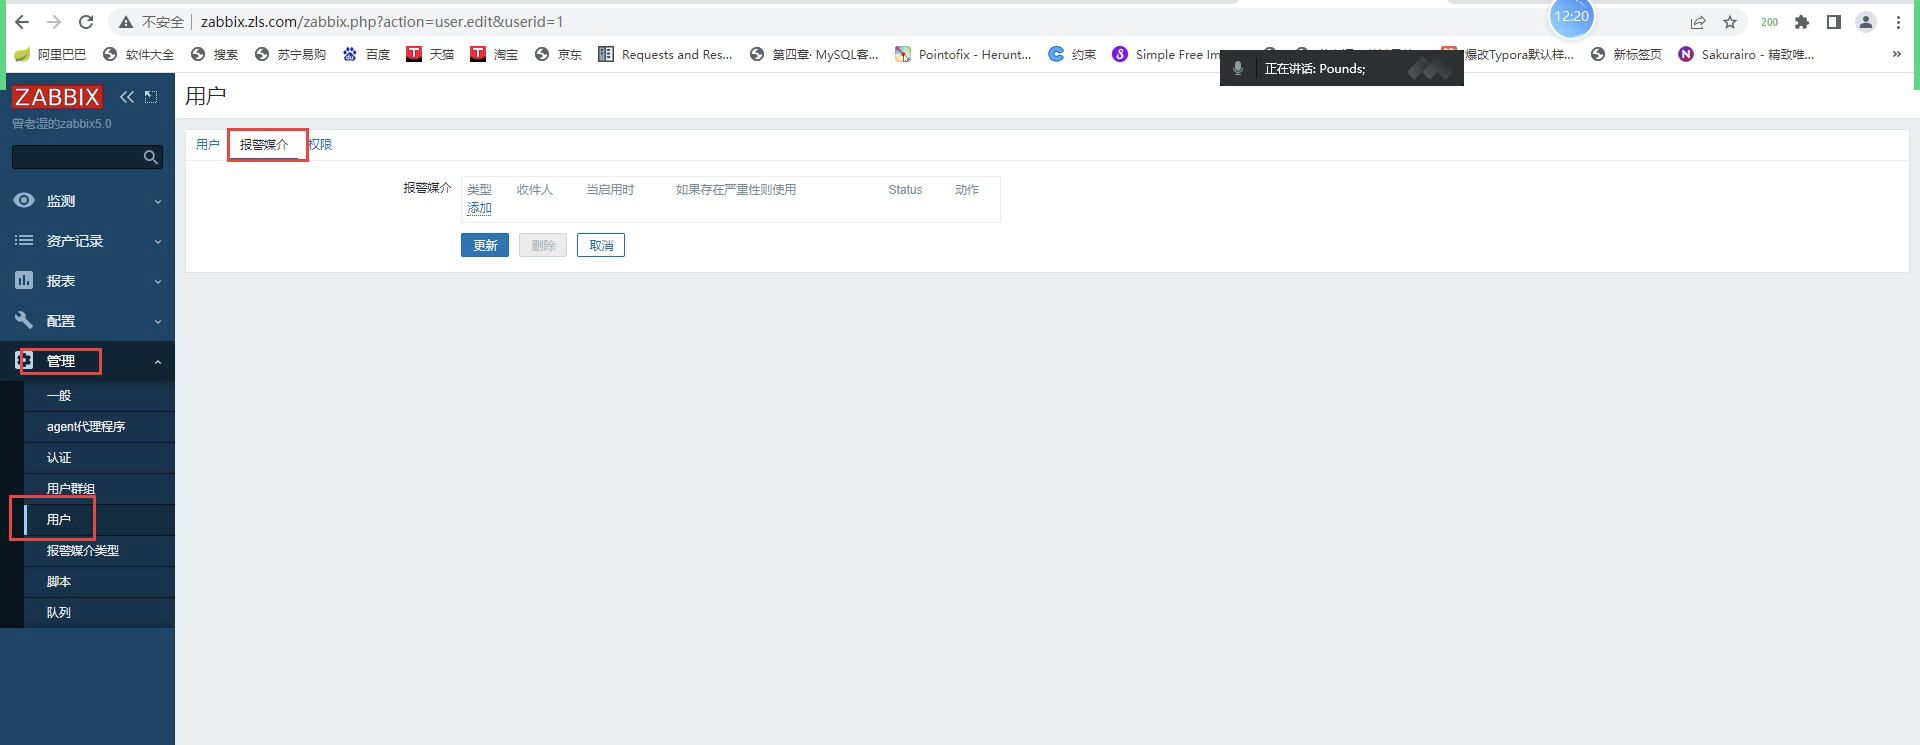
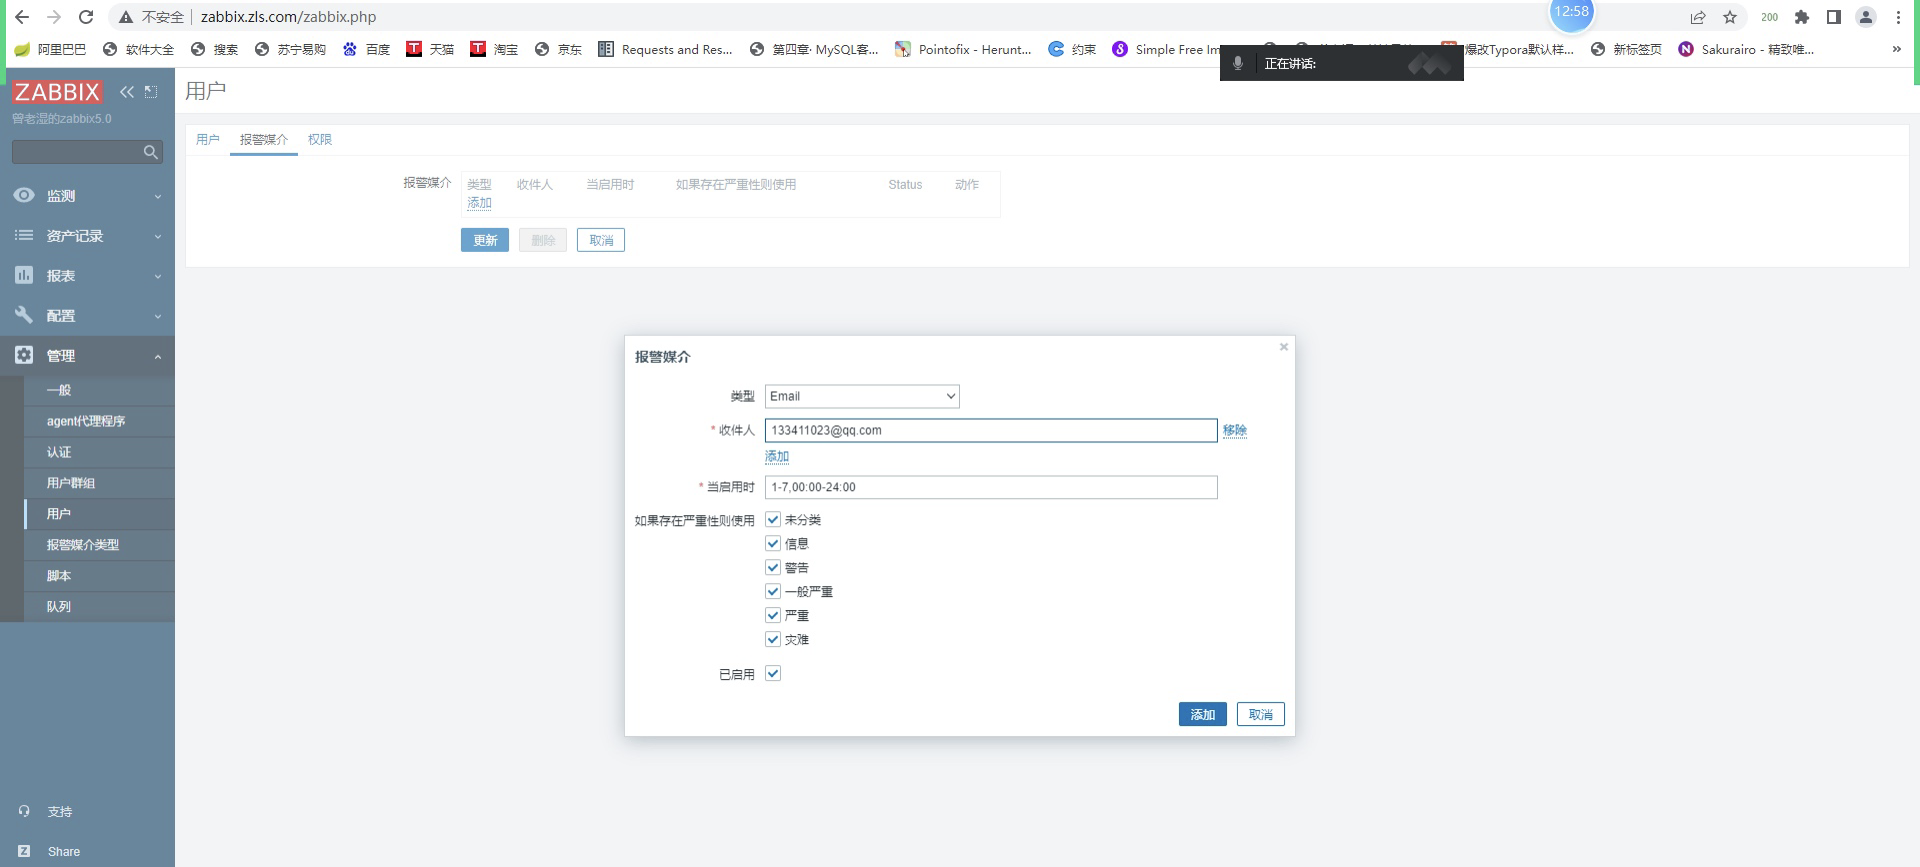
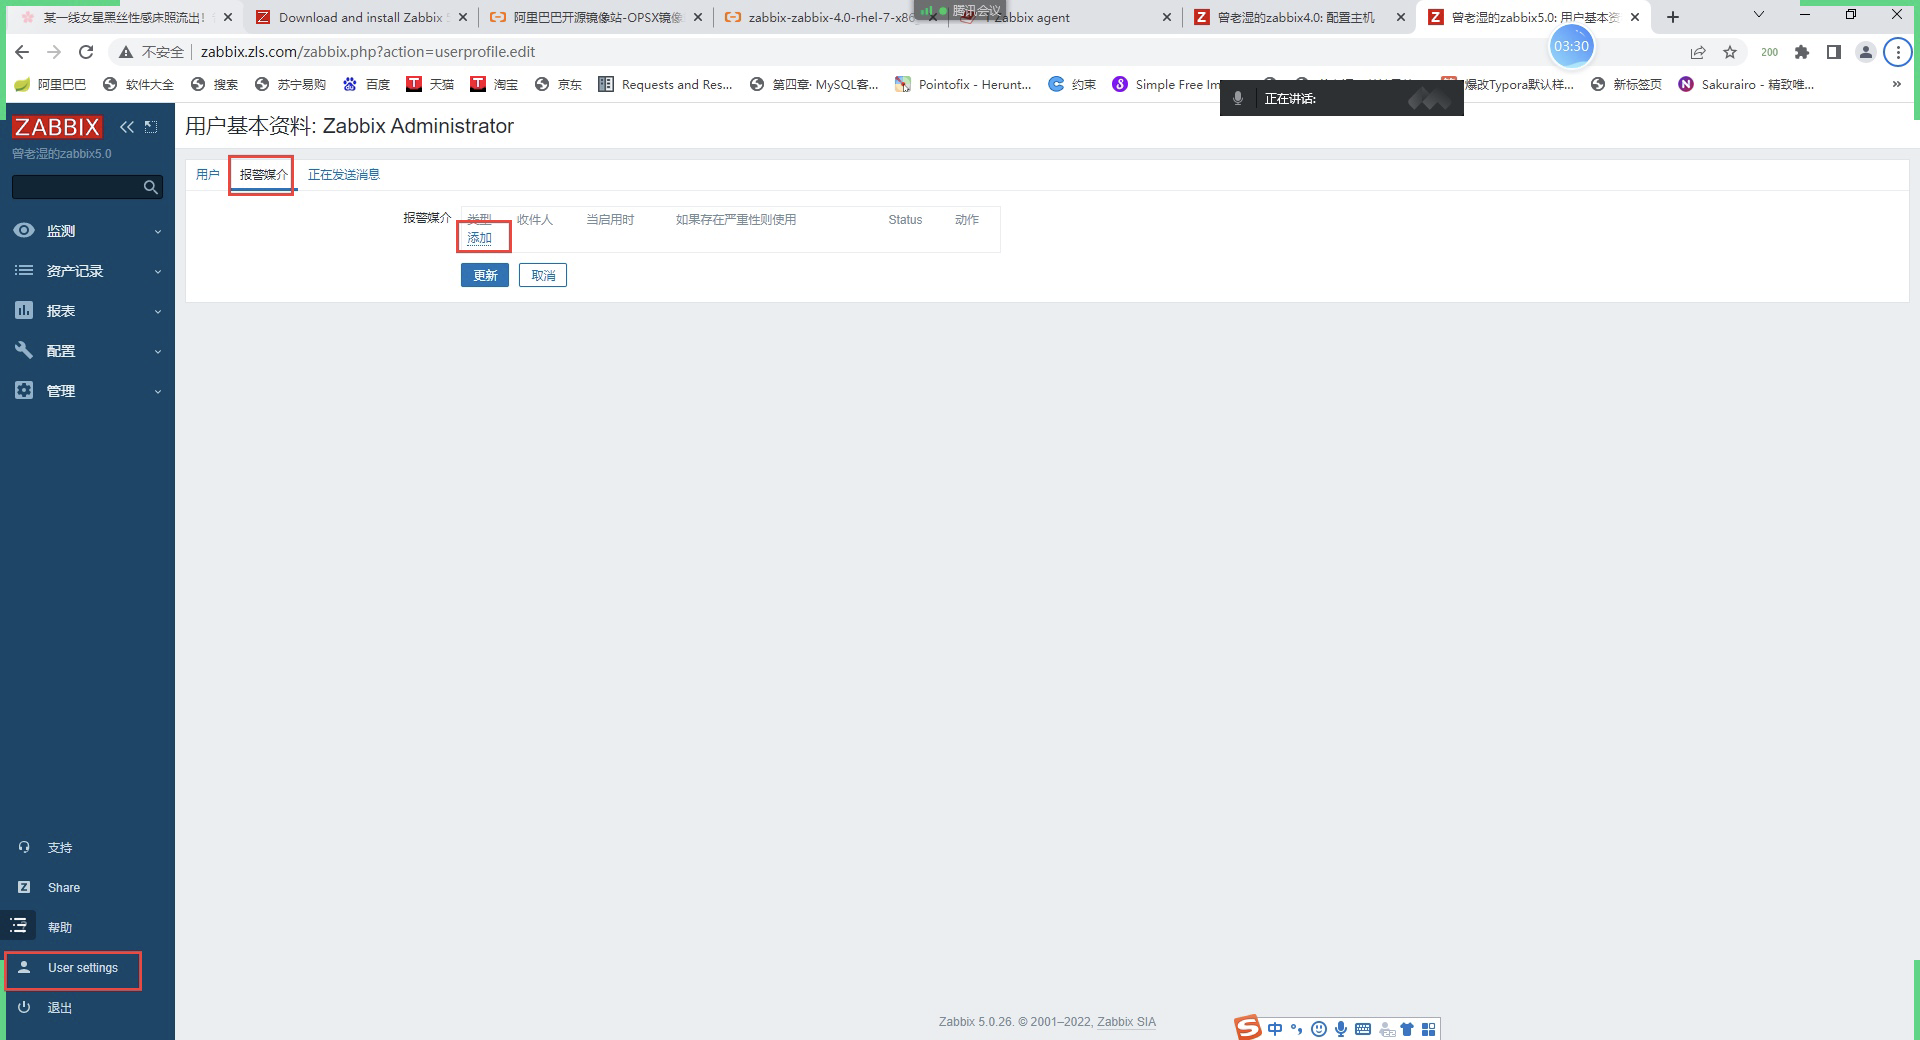
添加报警媒介
告警消息添加 1 2 3 4 5 6 7 8 9 10 11 12 13 14 15 16 17 18 19 20 21 标题:Problem: {EVENT.NAME} 内容: Problem started at {EVENT.TIME} on {EVENT.DATE} Problem name: {EVENT.NAME} Host: {HOST.NAME} Severity: {EVENT.SEVERITY} Original problem ID: {EVENT.ID} {TRIGGER.URL} 标题:Resolved: {EVENT.NAME} 内容: Problem has been resolved at {EVENT.RECOVERY.TIME} on {EVENT.RECOVERY.DATE} Problem name: {EVENT.NAME} Host: {HOST.NAME} Severity: {EVENT.SEVERITY} Original problem ID: {EVENT.ID} {TRIGGER.URL}
优化告警消息
1 2 3 4 5 6 7 8 9 10 11 12 13 14 15 16 17 18 19 20 21 22 23 24 25 26 27 28 29 30 31 32 33 34 35 36 37 38 39 40 41 故障{TRIGGER.STATUS},服务器:{HOSTNAME1}发生: {TRIGGER.NAME}故障! 告警地址:{HOST.IP} 告警主机:{HOSTNAME1} 告警时间:{EVENT.DATE} {EVENT.TIME} 告警等级:{TRIGGER.SEVERITY} 告警信息: {TRIGGER.NAME} 告警项目:{TRIGGER.KEY1} 问题详情:{ITEM.NAME}:{ITEM.VALUE} 当前状态:{TRIGGER.STATUS}:{ITEM.VALUE1} 事件ID:{EVENT.ID} 恢复{TRIGGER.STATUS}, 服务器:{HOSTNAME1}: {TRIGGER.NAME}已恢复! 告警地址:{HOST.IP} 告警主机:{HOSTNAME1} 告警时间:{EVENT.DATE} {EVENT.TIME} 告警等级:{TRIGGER.SEVERITY} 告警信息: {TRIGGER.NAME} 告警项目:{TRIGGER.KEY1} 问题详情:{ITEM.NAME}:{ITEM.VALUE} 当前状态:{TRIGGER.STATUS}:{ITEM.VALUE1} 事件ID:{EVENT.ID}
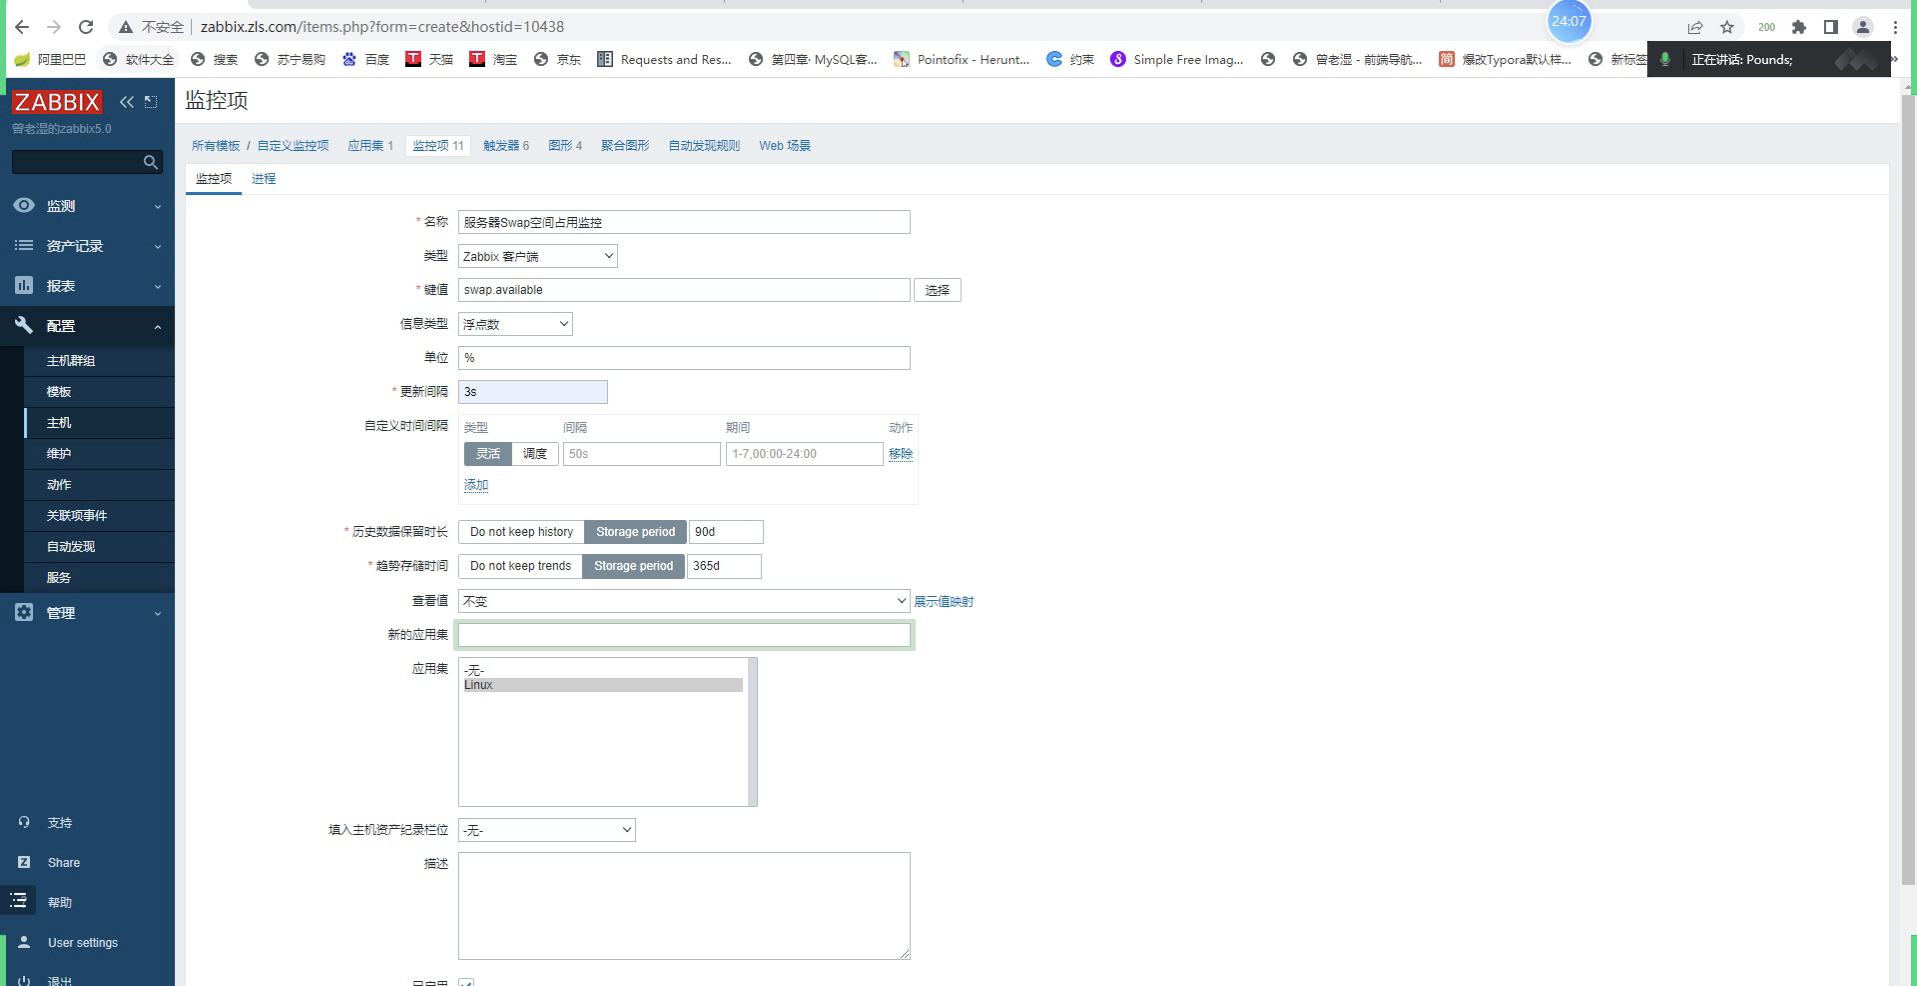
Zabbix深入自定义监控 zabbix多条件触发 监控内存可用的百分比
1 UserParameter=mem.available,free -m|awk 'NR==2{print $NF/$2*100}'
目前属于单条件触发器,因为内存低于30%就报警了,在生产中,我们应该是当内存低于30%并且占用了swap空间,然后再报警。
1 2 3 UserParameter=swap.available,free -m|awk '/^Swap/{print $NF/$2*100}' [root@sb_wzj web]
1 2 3 4 5 6 7 8 and or last() avg() diff() nodata() (5m) (
zabbix 5.x以上告警 故障告警
1 2 3 4 5 6 7 8 9 10 11 12 13 14 15 16 17 18 19 20 21 22 23 24 25 26 27 28 29 30 31 32 33 34 35 36 37 38 39 40 41 42 43 44 45 46 47 48 49 50 51 52 53 54 55 56 57 <head > <style type ="text/css" > table .guzhang {color : red;} </style > </head > <body > <img src ="https://blog.driverzeng.com/zenglaoshi/sos.png" alt ="" > <table border ="3" bordercolor ="black" cellspacing ="0px" cellpadding ="4px" width ="500px" > <tr class ="guzhang" bgcolor ="#0C1B3D" > <th colspan =2 > {TRIGGER.STATUS} 故障!!!故障!!! <div > 😂 😂 😂 </div > </tr > <tr > <td bgcolor ="#F9B602" width ="20%" > 告警主机</td > <td bgcolor ="#F9B602" > {HOSTNAME1}</td > </tr > <tr > <td bgcolor ="#F9B602" > 告警别名</td > <td bgcolor ="#F9B602" > {HOST.NAME} </td > <tr > <tr > <td bgcolor ="#F9B602" > 告警地址</td > <td bgcolor ="#F9B602" > {HOST.IP}</td > </tr > <tr > <td bgcolor ="#F9B602" > 告警时间</td > <td bgcolor ="#F9B602" > {EVENT.DATE} {EVENT.TIME}</td > </tr > <tr > <td bgcolor ="#F9B602" > 告警等级</td > <td bgcolor ="#F9B602" > {TRIGGER.SEVERITY}</td > </tr > <tr > <td bgcolor ="#F9B602" > 告警信息</td > <td bgcolor ="#F9B602" > {TRIGGER.NAME}</td > </tr > <tr > <td bgcolor ="#F9B602" > 告警项目</td > <td bgcolor ="#F9B602" > {TRIGGER.KEY1}</td > </tr > <tr > <td class ='guzhang2' bgcolor ="#FF3333" > 问题详情</td > <td class ='guzhang3' bgcolor ="#FF3333" > {ITEM.NAME}: {ITEM.VALUE} 😈 😈 😈 </td > </tr > <tr > <td bgcolor ="#F9B602" > 当前状态</td > <td bgcolor ="#F9B602" > {TRIGGER.STATUS}: {ITEM.VALUE1}</td > </tr > <tr > <td bgcolor ="#F9B602" > 事件ID</td > <td bgcolor ="#F9B602" > {EVENT.ID}</td > </tr > </table > </body >
恢复告警
1 2 3 4 5 6 7 8 9 10 11 12 13 14 15 16 17 18 19 20 21 22 23 24 25 26 27 28 29 30 31 32 33 34 35 36 37 38 39 40 41 42 43 44 45 46 47 48 49 50 51 52 53 54 55 56 57 58 59 <head > <style type ="text/css" > table .guzhang { color: red; } </style > </head > <body > <img src ="https://blog.driverzeng.com/zenglaoshi/huifu.png" alt ="" > <table border ="1" bordercolor ="black" cellspacing ="0px" cellpadding ="4px" width ="500px" > <tr bgcolor ="#49c208" > <th colspan =2 > {TRIGGER.STATUS} 哈哈哈哈哈哈,好了 <div > 😀 😀 😀 </div > </tr > <tr > <td bgcolor ="lightgreen" width ="20%" > 恢复主机</td > <td bgcolor ="yellow" > {HOSTNAME1}</td > </tr > <tr > <td bgcolor ="lightgreen" > 恢复别名</td > <td bgcolor ="yellow" > {HOST.NAME} </td > <tr > <td bgcolor ="lightgreen" > 恢复地址</td > <td bgcolor ="yellow" > {HOST.IP}</td > </tr > <tr > <td bgcolor ="lightgreen" > 恢复时间</td > <td bgcolor ="yellow" > {EVENT.DATE} {EVENT.RECOVERY.TIME}</td > </tr > <tr > <td bgcolor ="lightgreen" > 恢复等级</td > <td bgcolor ="yellow" > {TRIGGER.SEVERITY}</td > </tr > <tr > <td bgcolor ="lightgreen" > 恢复信息</td > <td bgcolor ="yellow" > {TRIGGER.NAME}</td > </tr > <tr > <td bgcolor ="lightgreen" > 恢复项目</td > <td bgcolor ="yellow" > {TRIGGER.KEY1}</td > </tr > <tr > <td bgcolor ="#49c208" > 恢复详情</td > <td bgcolor ="#49c208" > {ITEM.NAME}: {ITEM.VALUE} ⚡ ⚡ ⚡ </td > </tr > <tr > <td bgcolor ="lightgreen" > 当前状态</td > <td bgcolor ="yellow" > {TRIGGER.STATUS}: {ITEM.VALUE1}</td > </tr > <tr > <td bgcolor ="lightgreen" > 事件ID</td > <td bgcolor ="yellow" > {EVENT.ID}</td > </tr > </table > </body >
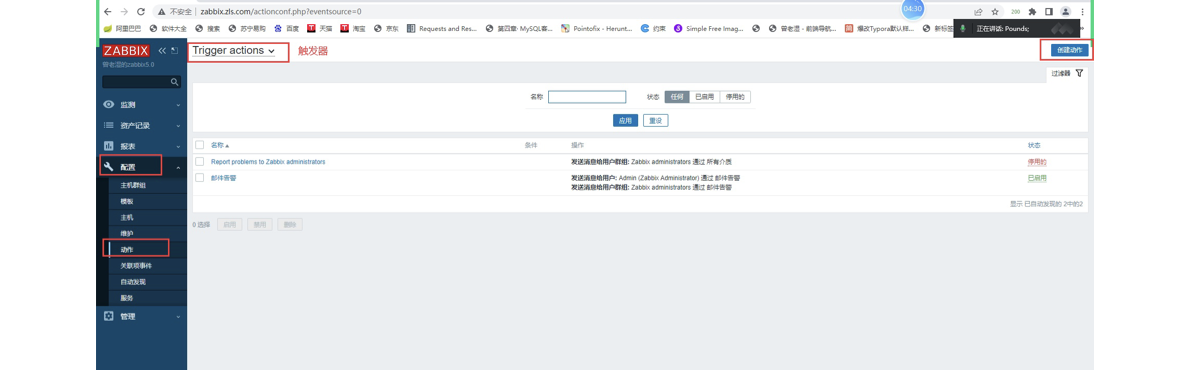
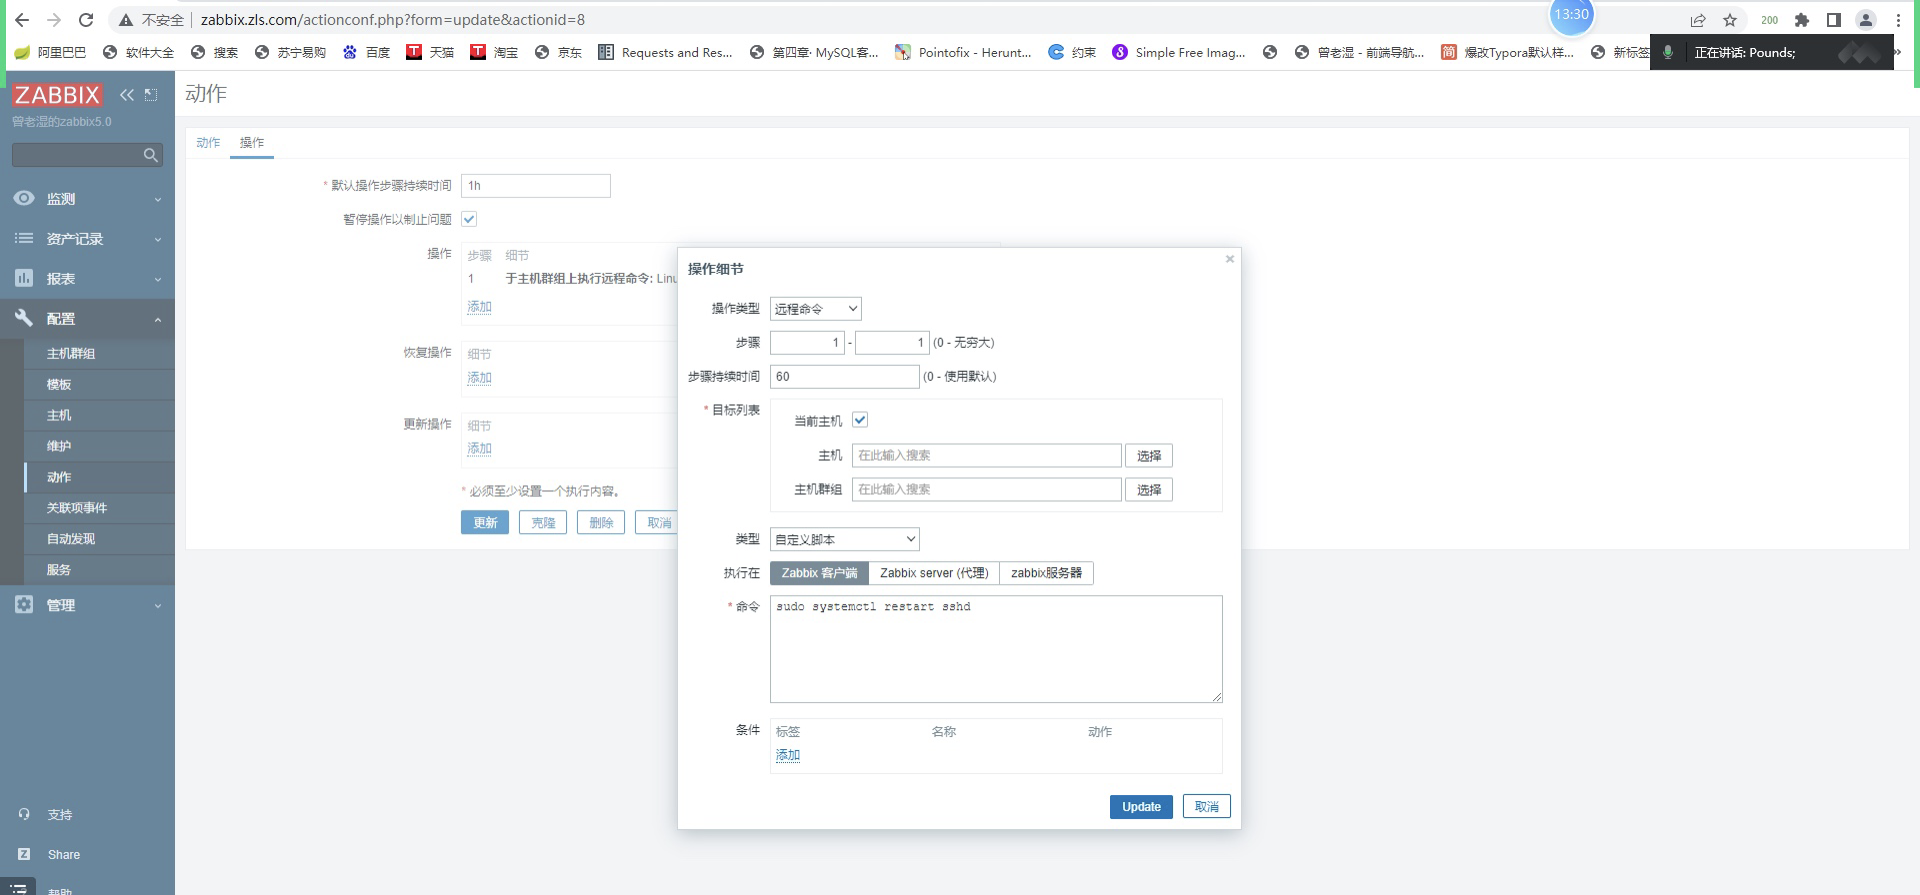
zabbix的自愈模式 有些时候,我们的服务宕机了,或者有些服务停掉了,那么我们可以先尝试让他启动,看是否能起的来,为了不影响用户的体验,先把服务起起来,然后再去排查,是什么原因故障的。
那么此时我们就需要用到zabbix的自愈模式,这个…叫起来很好听,说白了,就是在让zabbix-server通过远程执行命令的方式,在agent上执行命令,启动服务。
1 2 3 [root@web01 zabbix_agentd.d] EnableRemoteCommands=1
zabbix告警升级机制
计算方式:
开始于 ,这个是相对一但触发监控,则立即发送消息
1-2步骤是给运维组发送消息,每隔5分钟发送一次,总共2个步骤,所以发送2次
3-4步骤是给运维经理组发送消息,每隔5分钟发送一次,总共2个步骤,所以发送2次
4-5步骤是给运维总监组发送消息,每隔5分钟发送一次,总共2个步骤,所以发送2次
每次的开始时间是如何计算的呢,第一个立即开始:
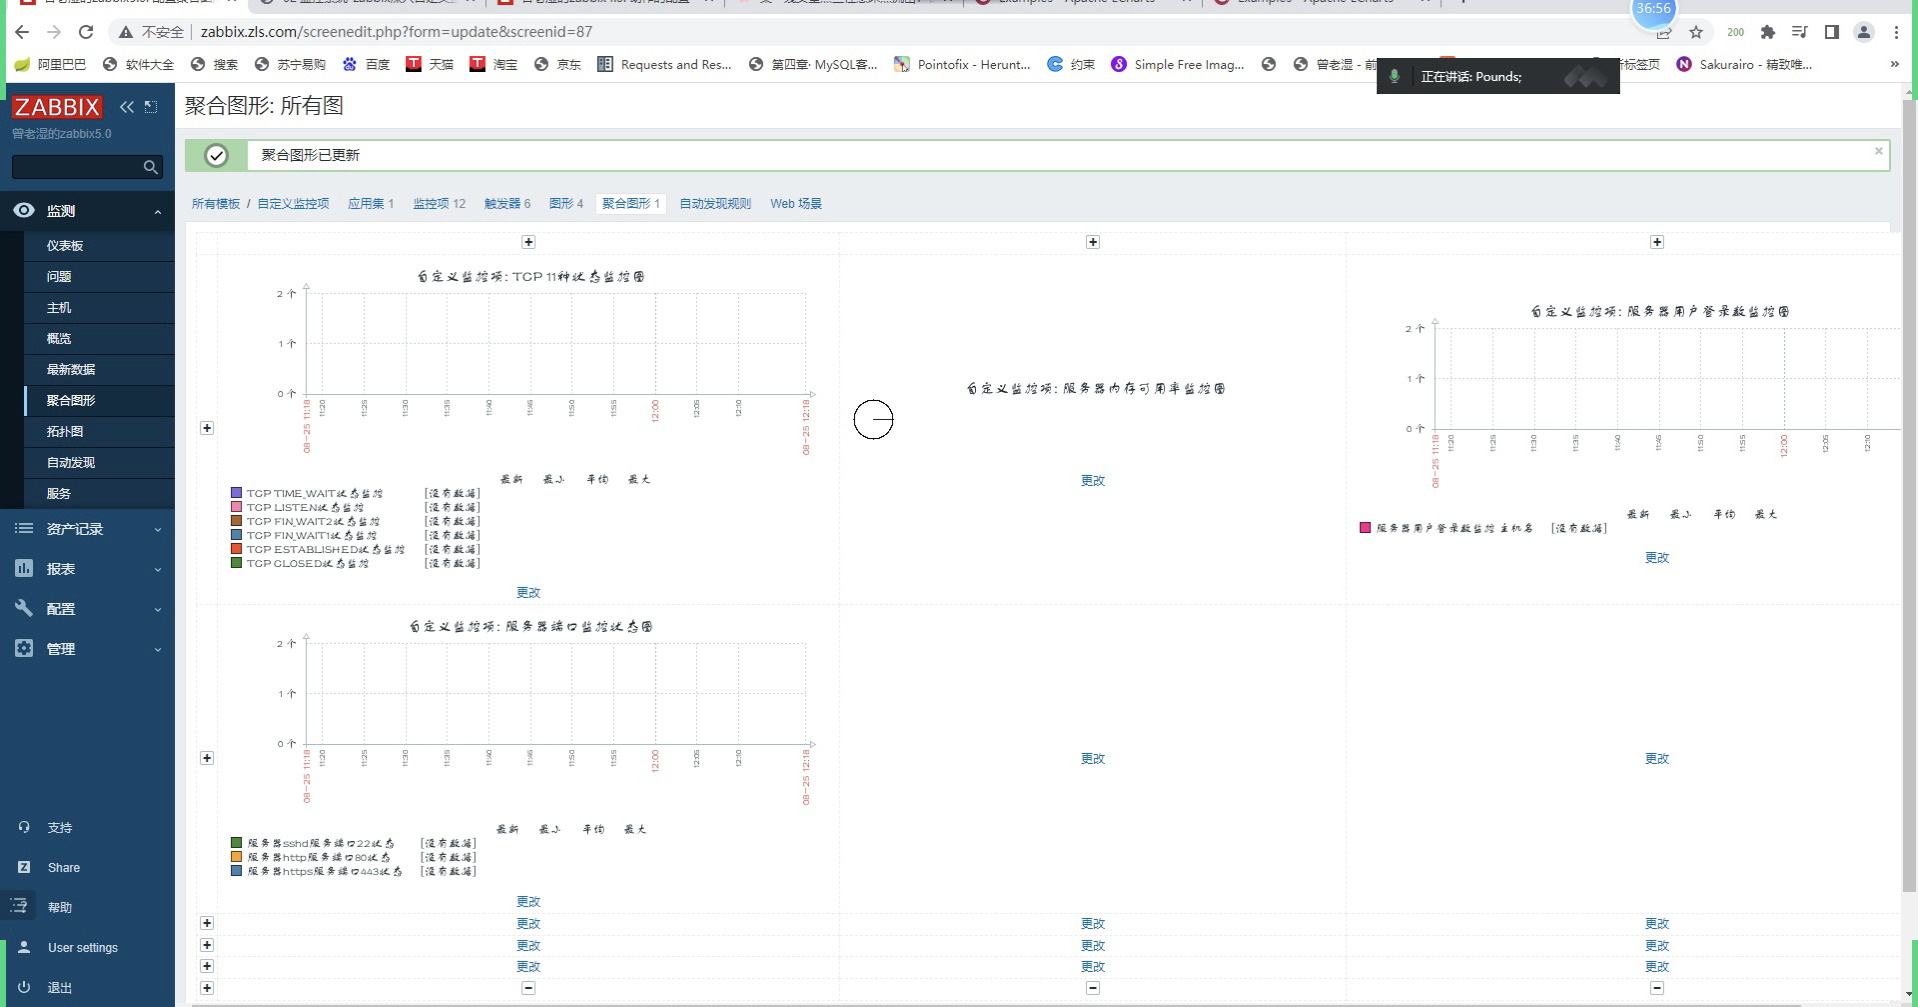
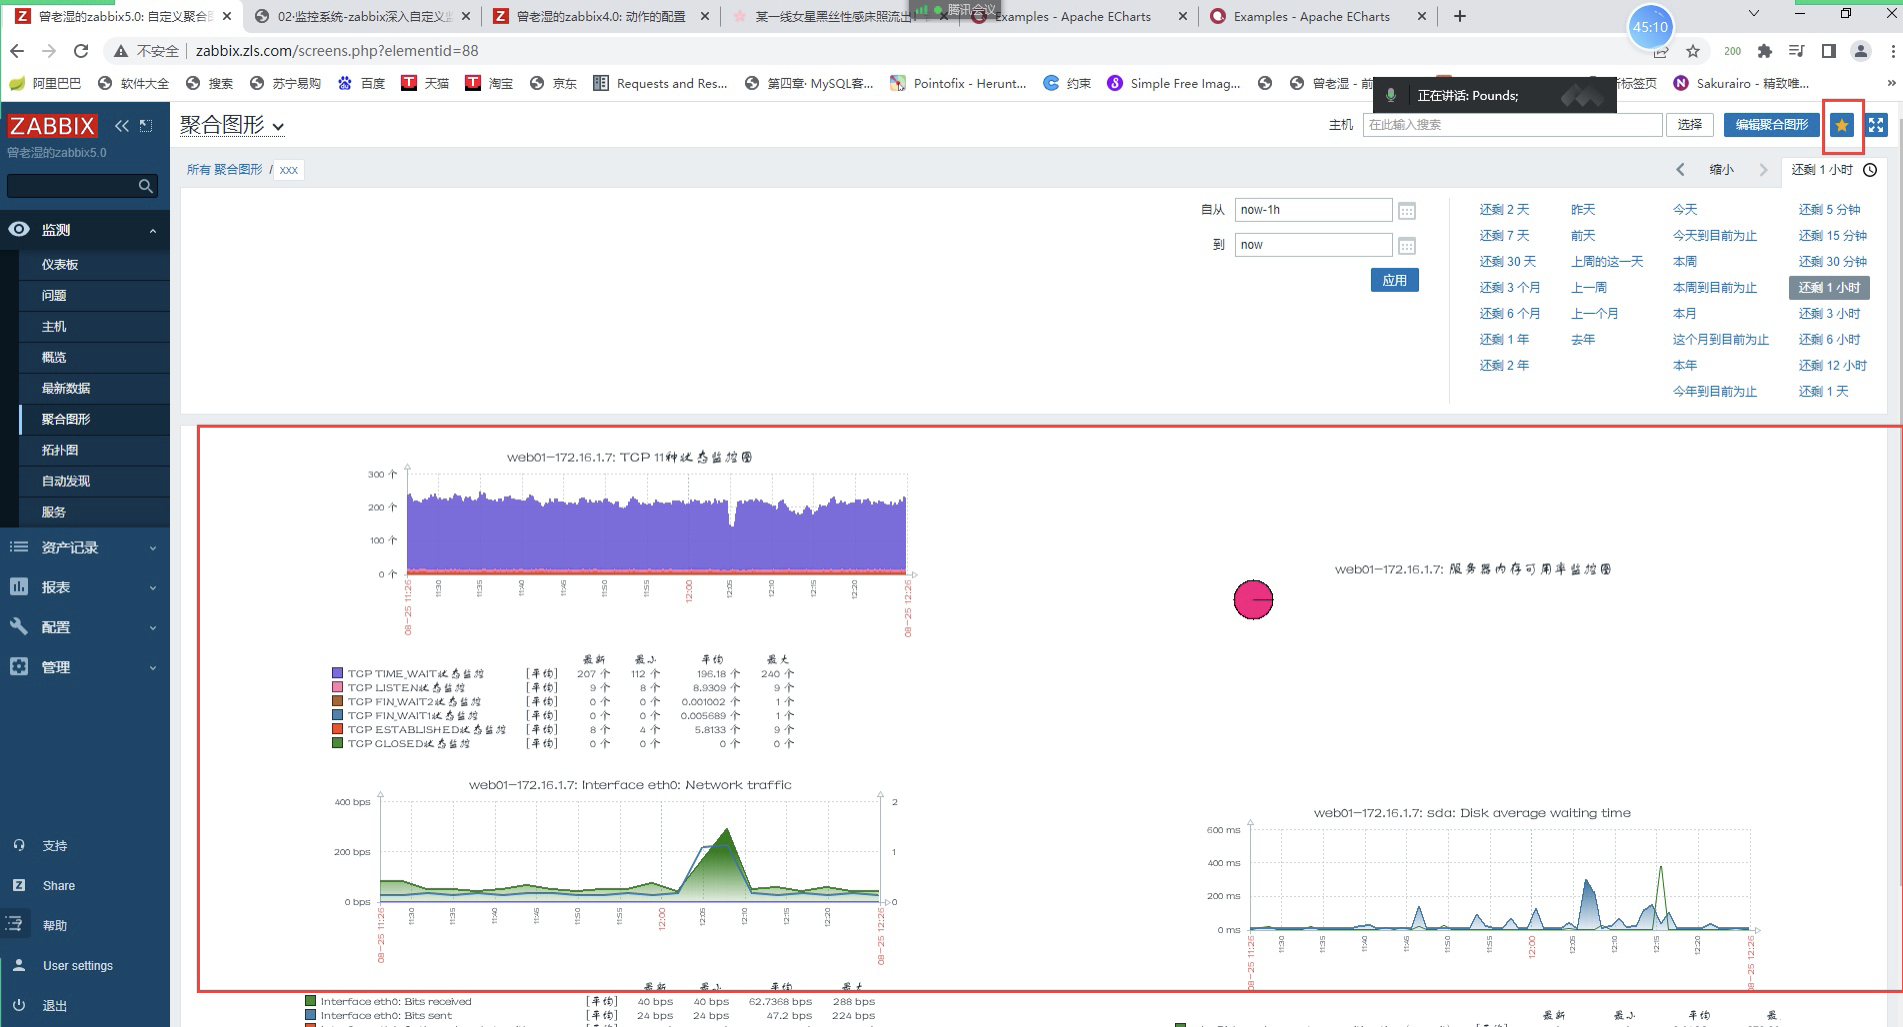
聚合图形
zabbix微信报警 1 2 3 4 5 6 7 8 9 10 11 12 13 14 15 16 17 18 19 20 21 22 23 24 25 26 27 28 29 30 31 32 33 34 35 36 [root@sb_wzj web] [root@sb_wzj ~] [root@sb_wzj ~] [root@sb_wzj alertscripts] import requests import json import sys import os headers = {'Content-Type' : 'application/json;charset=utf-8' } api_url = "https://qyapi.weixin.qq.com/cgi-bin/webhook/send?key=b3f00bb1-3198-4491-9429-a9fbe5444e23" def msg(text): json_text= { "msgtype" : "text" , "text" : { "content" : text }, } print (requests.post(api_url,json.dumps(json_text),headers=headers).content) if __name__ == '__main__' : text = sys.argv[1] msg(text) [root@sb_wzj alertscripts]
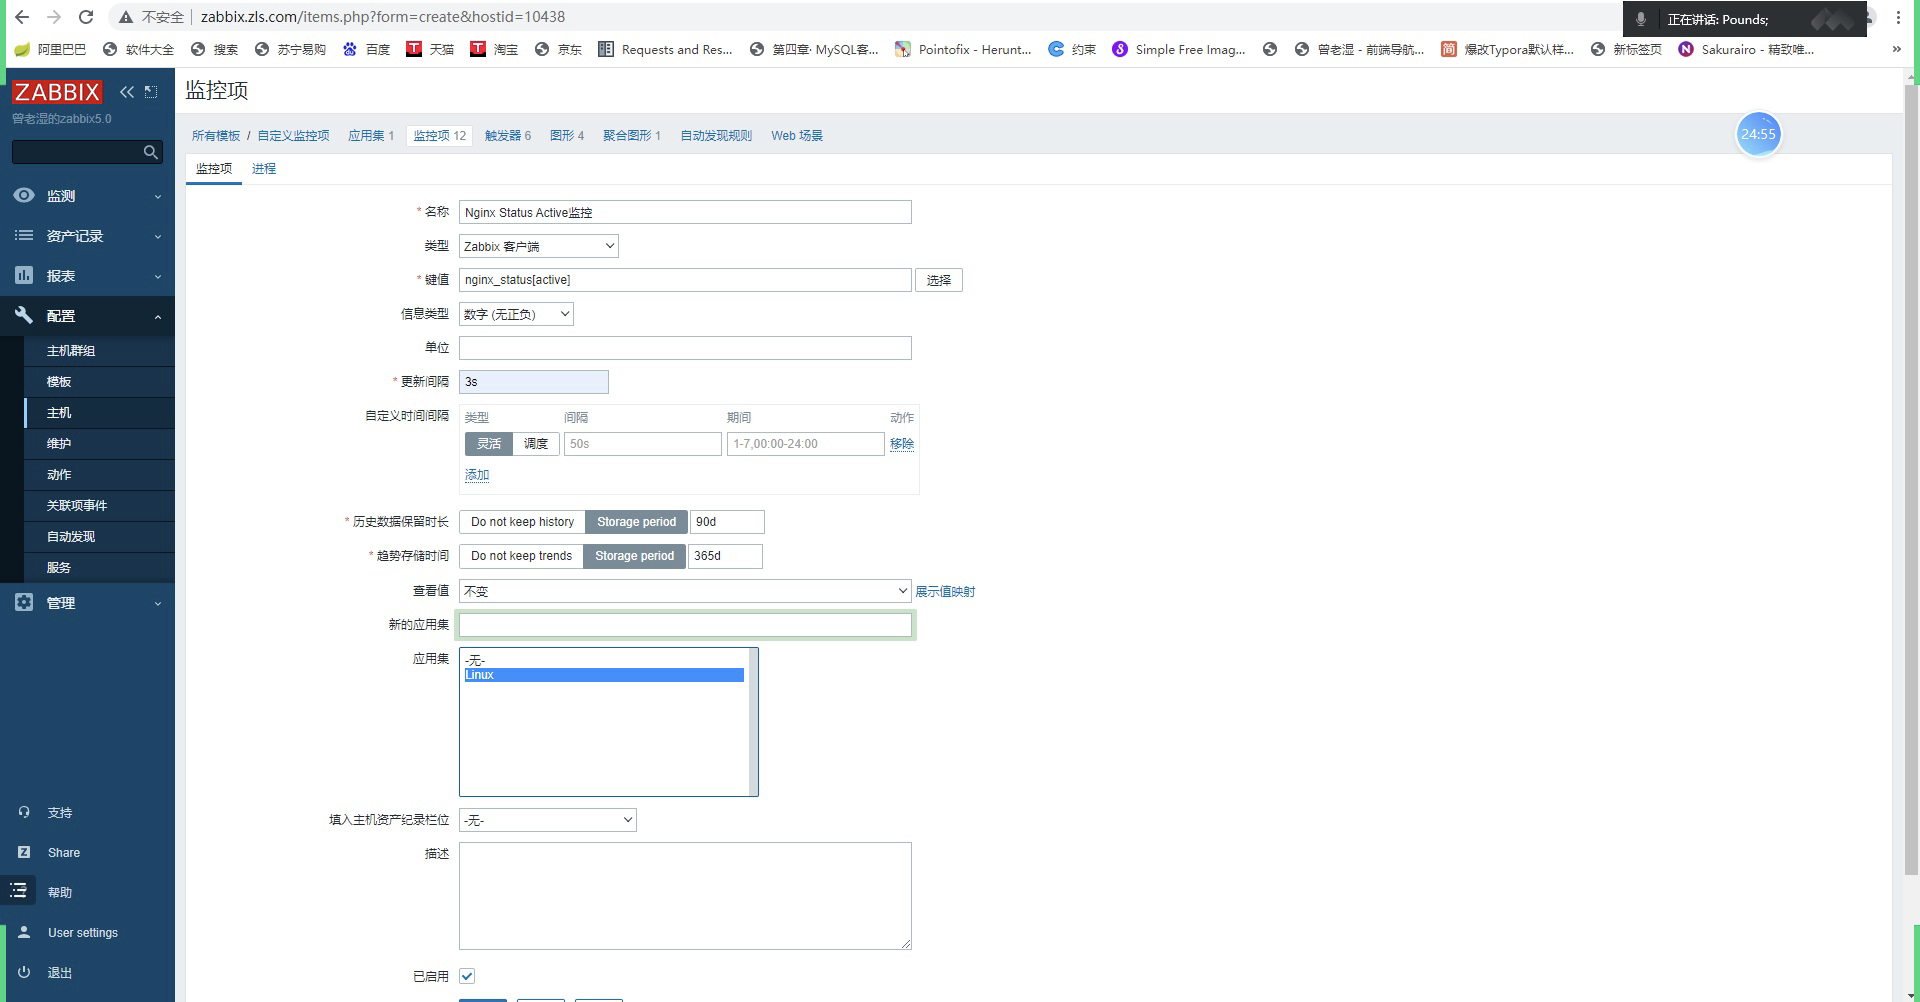
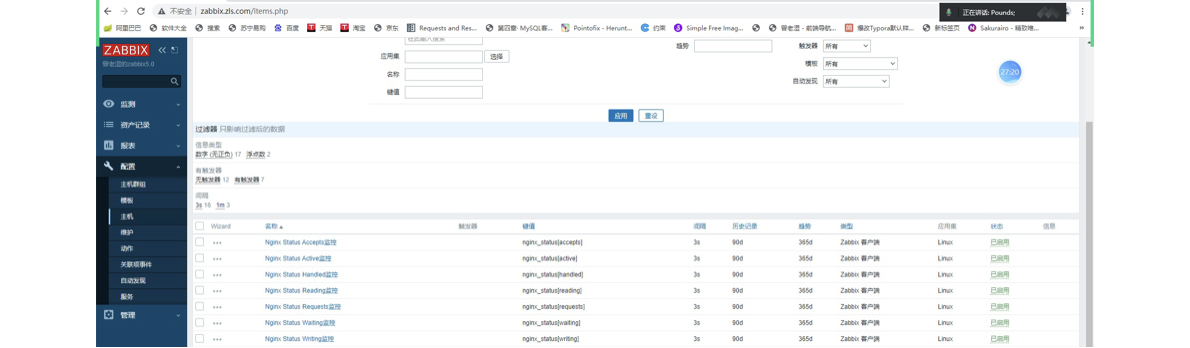
zabbix 应用监控 监控nginx 1 2 3 4 5 6 7 8 9 10 11 12 13 14 15 16 17 18 19 20 21 22 23 24 25 26 27 28 29 30 31 32 33 34 35 36 37 38 39 40 41 42 43 44 45 46 47 48 49 50 51 52 53 54 55 56 57 58 59 60 61 62 63 64 65 66 67 68 69 70 71 72 73 74 75 76 77 78 79 80 81 82 83 84 85 86 87 88 89 90 91 [root@web01 ~] [root@web01 ~] #!/bin/bash NGINX_PORT=80 NGINX_COMMAND=$1 nginx_active /usr/bin/curl -s "http://127.0.0.1:" $NGINX_PORT "/nginx_status/" |awk '/Active/ {print $NF}' } nginx_reading /usr/bin/curl -s "http://127.0.0.1:" $NGINX_PORT "/nginx_status/" |awk '/Reading/ {print $2}' } nginx_writing /usr/bin/curl -s "http://127.0.0.1:" $NGINX_PORT "/nginx_status/" |awk '/Writing/ {print $4}' } nginx_waiting /usr/bin/curl -s "http://127.0.0.1:" $NGINX_PORT "/nginx_status/" |awk '/Waiting/ {print $6}' } nginx_accepts /usr/bin/curl -s "http://127.0.0.1:" $NGINX_PORT "/nginx_status/" |awk 'NR==3 {print $1}' } nginx_handled /usr/bin/curl -s "http://127.0.0.1:" $NGINX_PORT "/nginx_status/" |awk 'NR==3 {print $2}' } nginx_requests /usr/bin/curl -s "http://127.0.0.1:" $NGINX_PORT "/nginx_status/" |awk 'NR==3 {print $3}' } case $NGINX_COMMAND in active) nginx_active; ;; reading) nginx_reading; ;; writing) nginx_writing; ;; waiting) nginx_waiting; ;; accepts) nginx_accepts; ;; handled) nginx_handled; ;; requests) nginx_requests; ;; *) echo $"USAGE:$0 {active|reading|writing|waiting|accepts|handled|requests}" esac [root@web01 ~] [root@web01 ~] UserParameter=nginx_status[*],/bin/bash /etc/zabbix/scripts/nginx_status.sh "$1 " [root@web01 ~] [root@sb_wzj ~] 0 [root@sb_wzj ~] 19 [root@sb_wzj ~] 20
zabbix监控PHP 修改php配置 1 2 3 4 5 pm.status_path = /phpfpm_status [root@web01 ~]
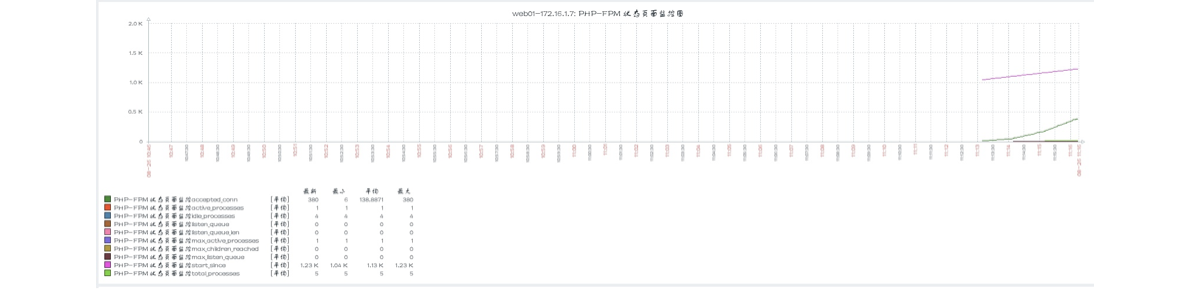
修改nginx配置 1 2 3 4 5 6 7 8 9 10 11 12 13 14 15 16 17 18 19 20 21 22 23 24 25 26 27 28 29 30 31 32 33 34 35 36 37 38 39 40 41 42 43 44 45 46 47 48 49 50 51 52 53 server { listen 80; server_name _; location /nginx_status { stub_status on; allow 127.0.0.1; deny all; } location ~ ^/(phpfpm_status)$ { include fastcgi_params; fastcgi_pass unix:/dev/shm/php.sock; fastcgi_param SCRIPT_FILENAME $document_root $fastcgi_script_name ; } } [root@web01 ~] [root@web01 ~] pool: www process manager: dynamic start time: 26/Aug/2022:10:55:47 +0800 start since: 165 accepted conn: 1 listen queue: 0 max listen queue: 0 listen queue len: 0 idle processes: 4 active processes: 1 total processes: 5 max active processes: 1 max children reached: 0 slow requests: 0 pool process manager start time start since accepted conn listen queue max listen queue listen queue len idle processes active processes total processes max active processes max children reached slow requests
编写监控脚本 1 2 3 4 5 6 7 8 9 10 11 12 13 14 15 16 17 18 19 20 21 22 23 24 25 26 27 28 29 30 31 32 33 34 35 36 37 38 39 40 41 42 43 44 45 46 47 48 49 50 51 52 53 54 55 56 57 58 59 60 61 62 63 64 65 66 67 68 69 70 71 72 73 74 75 76 77 78 79 80 81 82 83 84 85 86 87 88 89 90 91 92 93 94 95 96 97 98 99 100 [root@web01 ~] #!/bin/bash PHPFPM_COMMAND=$1 PHPFPM_PORT=80 start_since /usr/bin/curl -s "http://127.0.0.1:" $PHPFPM_PORT "/phpfpm_status" |awk '/^start since:/ {print $NF}' } accepted_conn /usr/bin/curl -s "http://127.0.0.1:" $PHPFPM_PORT "/phpfpm_status" |awk '/^accepted conn:/ {print $NF}' } listen_queue /usr/bin/curl -s "http://127.0.0.1:" $PHPFPM_PORT "/phpfpm_status" |awk '/^listen queue:/ {print $NF}' } max_listen_queue /usr/bin/curl -s "http://127.0.0.1:" $PHPFPM_PORT "/phpfpm_status" |awk '/^max listen queue:/ {print $NF}' } listen_queue_len /usr/bin/curl -s "http://127.0.0.1:" $PHPFPM_PORT "/phpfpm_status" |awk '/^listen queue len:/ {print $NF}' } idle_processes /usr/bin/curl -s "http://127.0.0.1:" $PHPFPM_PORT "/phpfpm_status" |awk '/^idle processes:/ {print $NF}' } active_processes /usr/bin/curl -s "http://127.0.0.1:" $PHPFPM_PORT "/phpfpm_status" |awk '/^active processes:/ {print $NF}' } total_processes /usr/bin/curl -s "http://127.0.0.1:" $PHPFPM_PORT "/phpfpm_status" |awk '/^total processes:/ {print $NF}' } max_active_processes /usr/bin/curl -s "http://127.0.0.1:" $PHPFPM_PORT "/phpfpm_status" |awk '/^max active processes:/ {print $NF}' } max_children_reached /usr/bin/curl -s "http://127.0.0.1:" $PHPFPM_PORT "/phpfpm_status" |awk '/^max children reached:/ {print $NF}' } slow_requests /usr/bin/curl -s "http://127.0.0.1:" $PHPFPM_PORT "/phpfpm_status" |awk '/^slow requests:/ {print $NF}' } case $PHPFPM_COMMAND in start_since) start_since; ;; accepted_conn) accepted_conn; ;; listen_queue) listen_queue; ;; max_listen_queue) max_listen_queue; ;; listen_queue_len) listen_queue_len; ;; idle_processes) idle_processes; ;; active_processes) active_processes; ;; total_processes) total_processes; ;; max_active_processes) max_active_processes; ;; max_children_reached) max_children_reached; ;; slow_requests) slow_requests; ;; *) echo $"USAGE:$0 {start_since|accepted_conn|listen_queue|max_listen_queue|listen_queue_len|idle_processes|active_processes|total_processes|max_active_processes|max_children_reached}" esac [root@web01 ~]
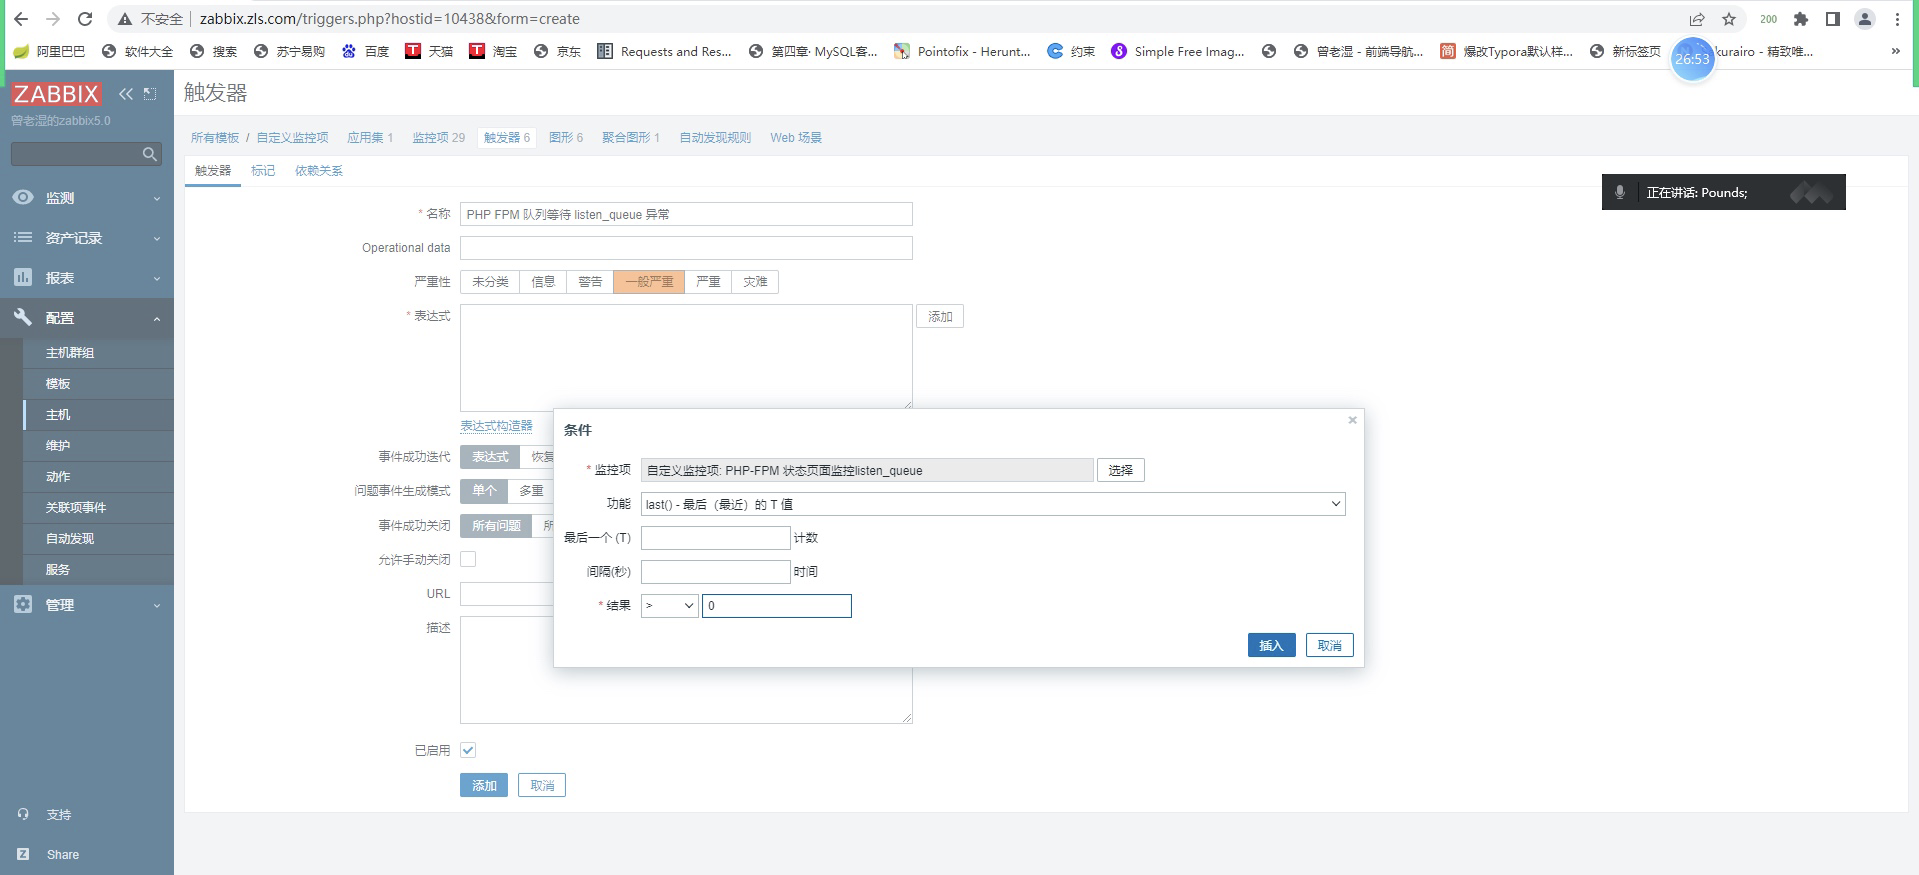
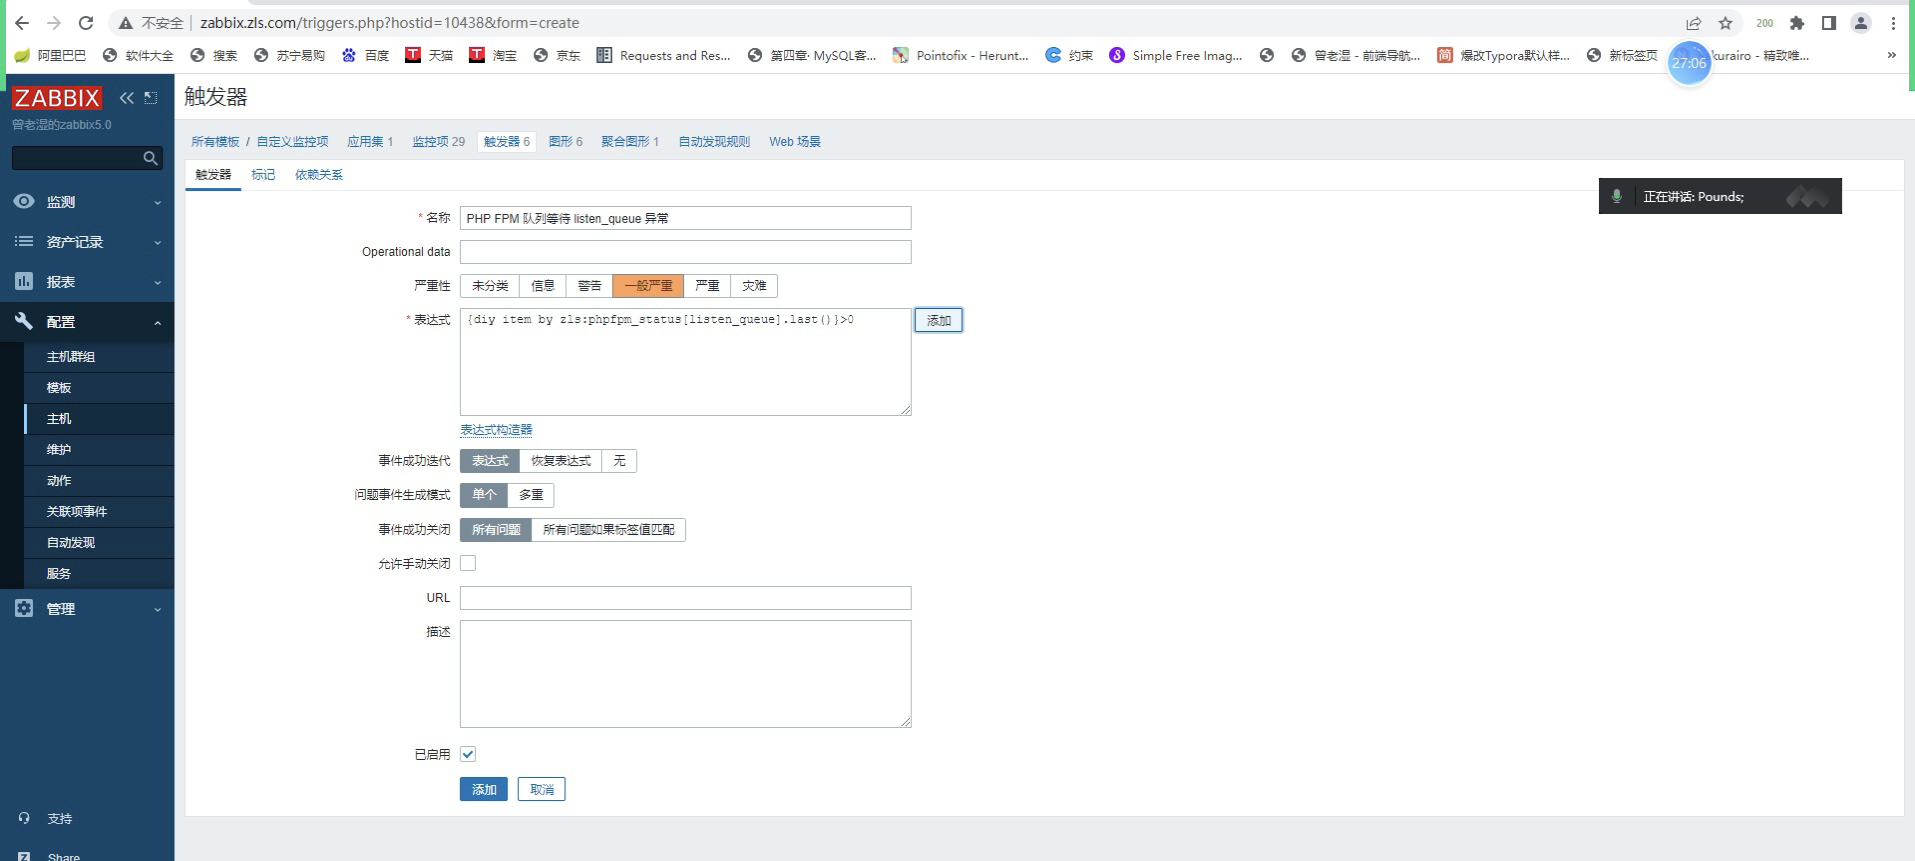
配置zabbix客户端加监控 1 2 3 4 5 6 7 8 9 10 11 [root@web01 ~] [root@web01 ~] UserParameter=phpfpm_status[*],/bin/bash /etc/zabbix/scripts/phpfpm_status.sh "$1 " [root@web01 ~] [root@sb_wzj ~] 891 [root@sb_wzj ~] 3 [root@sb_wzj ~] 0
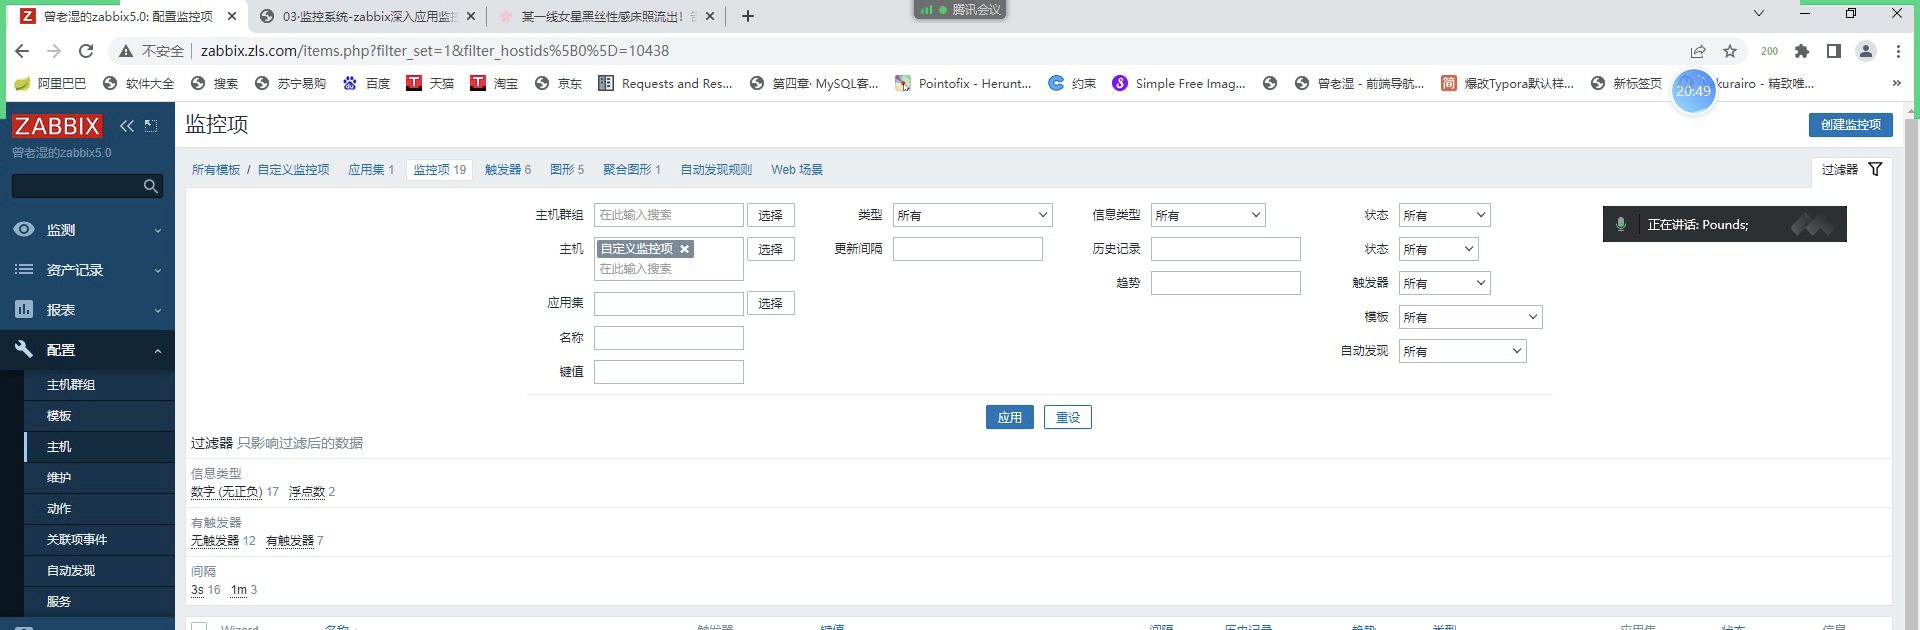
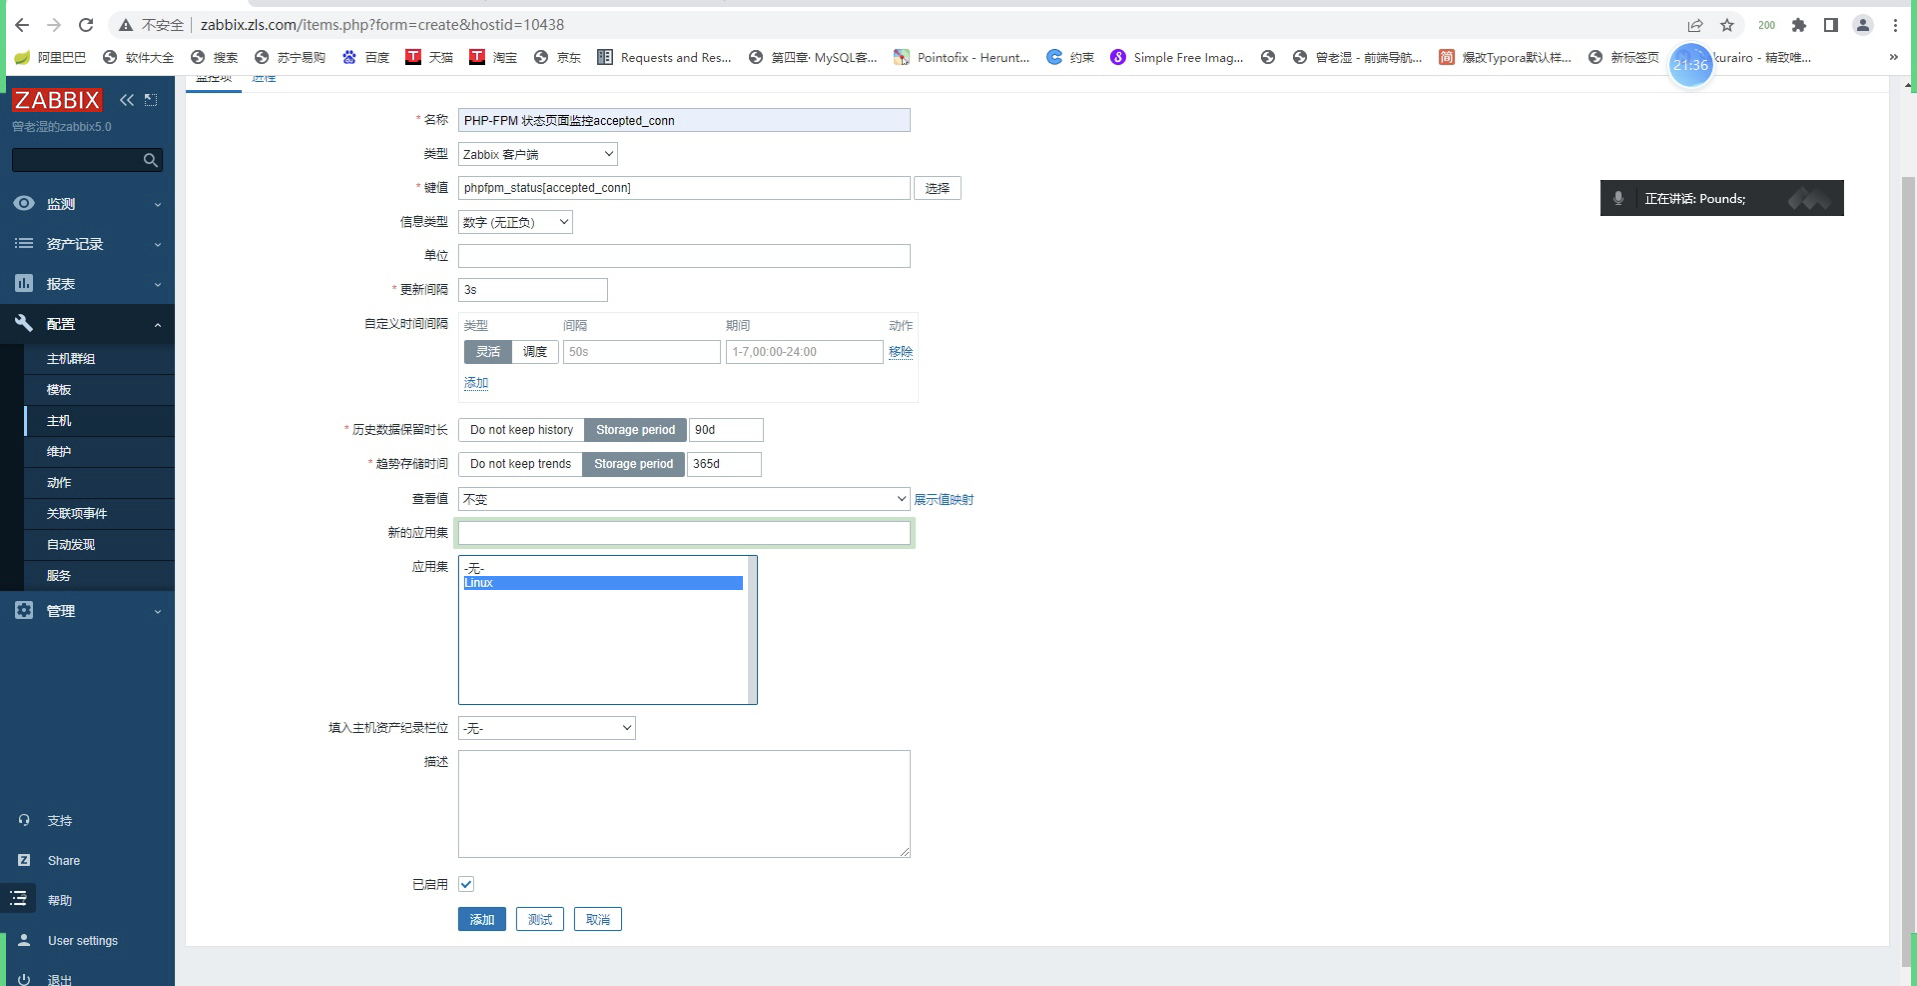
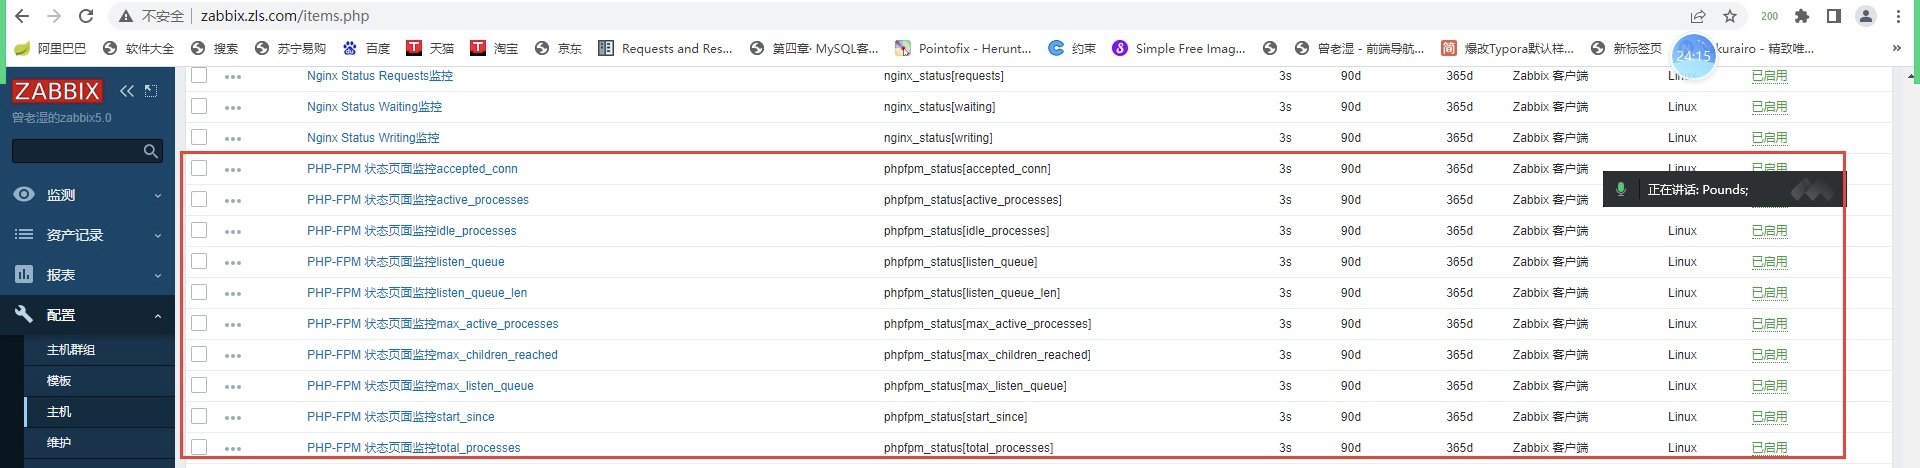
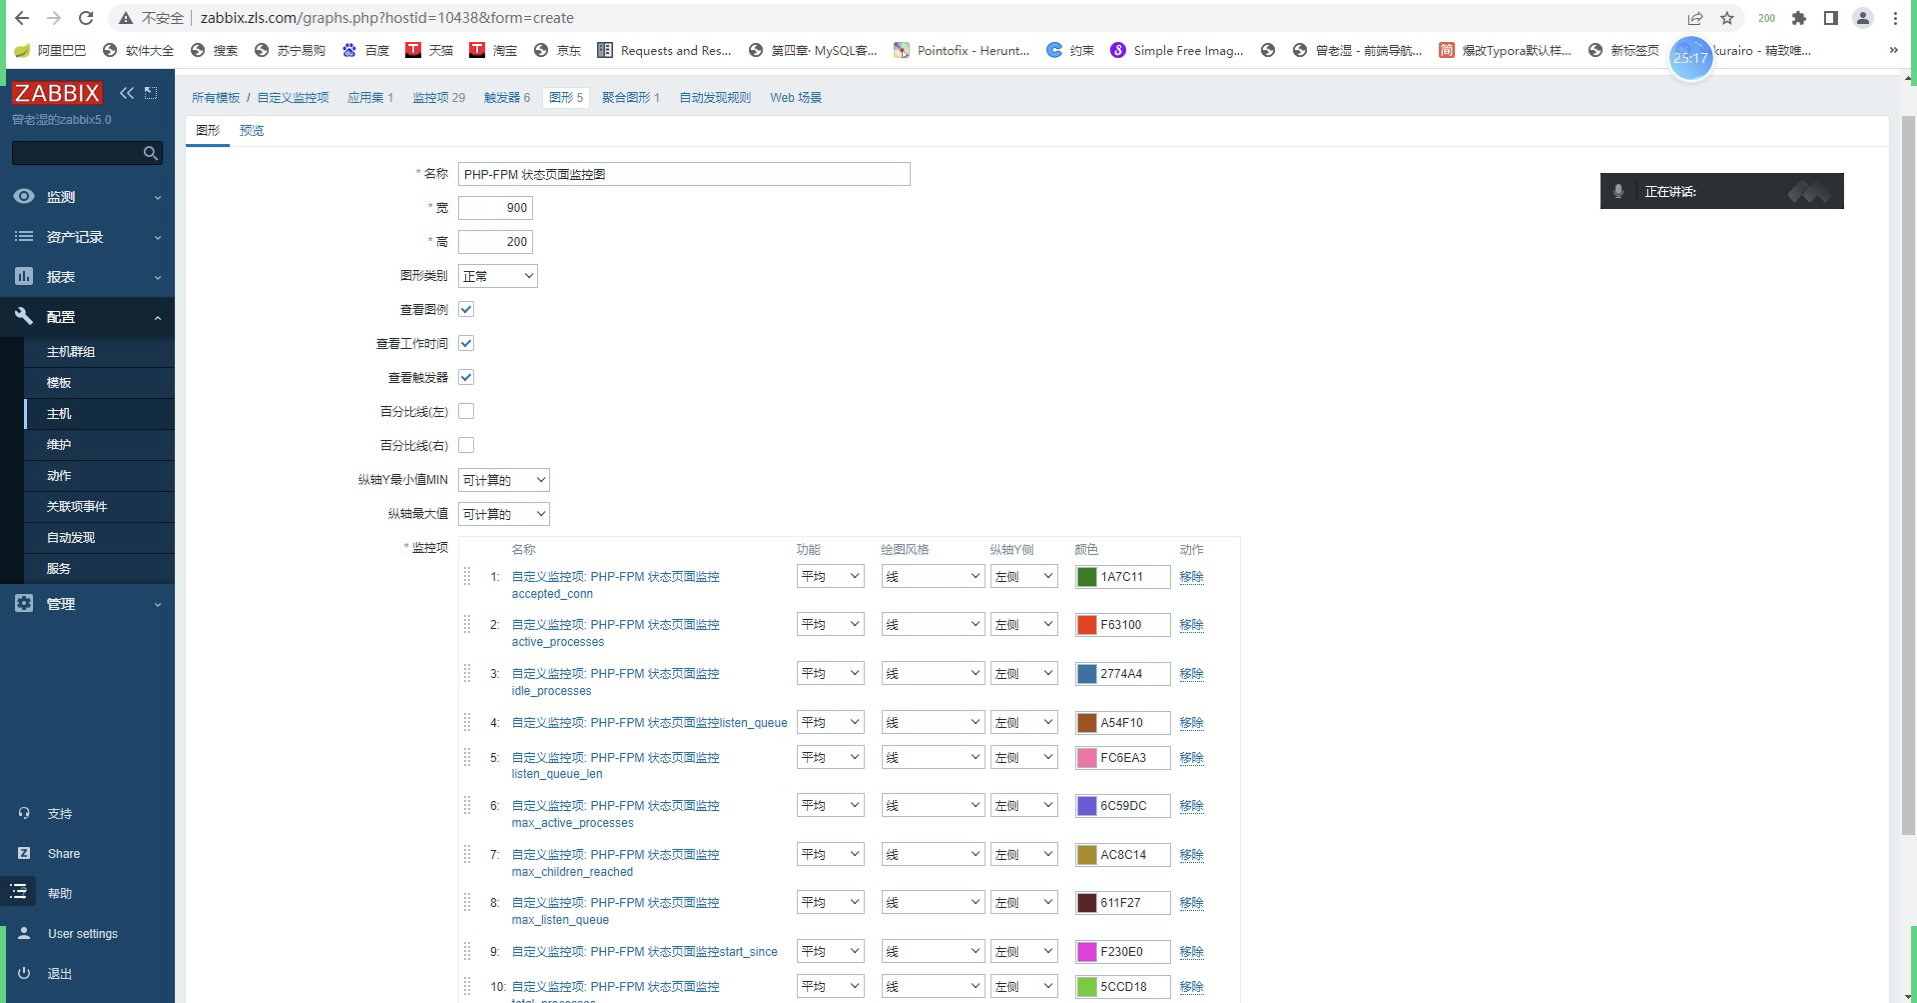
页面添加监控项
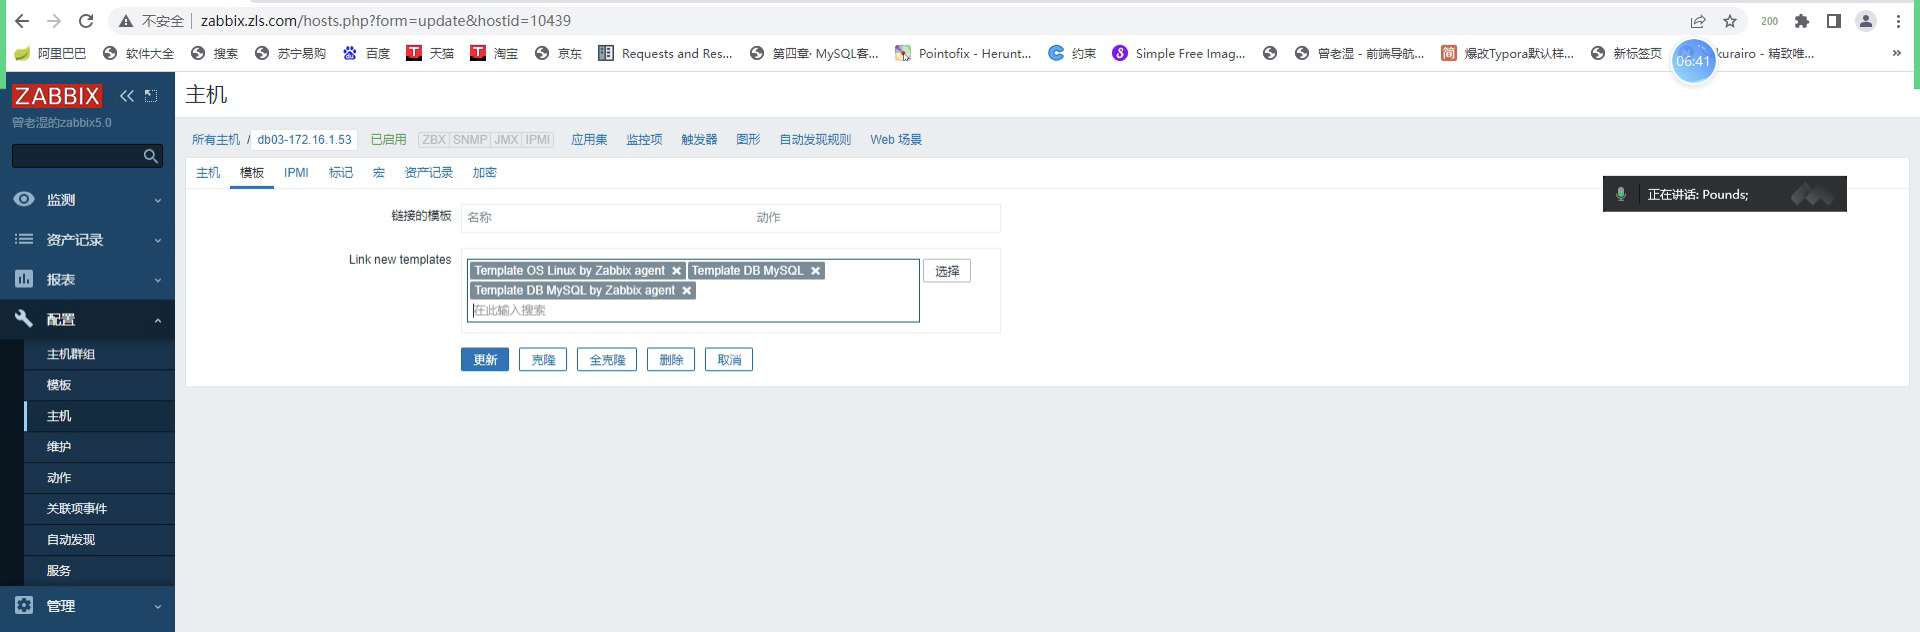
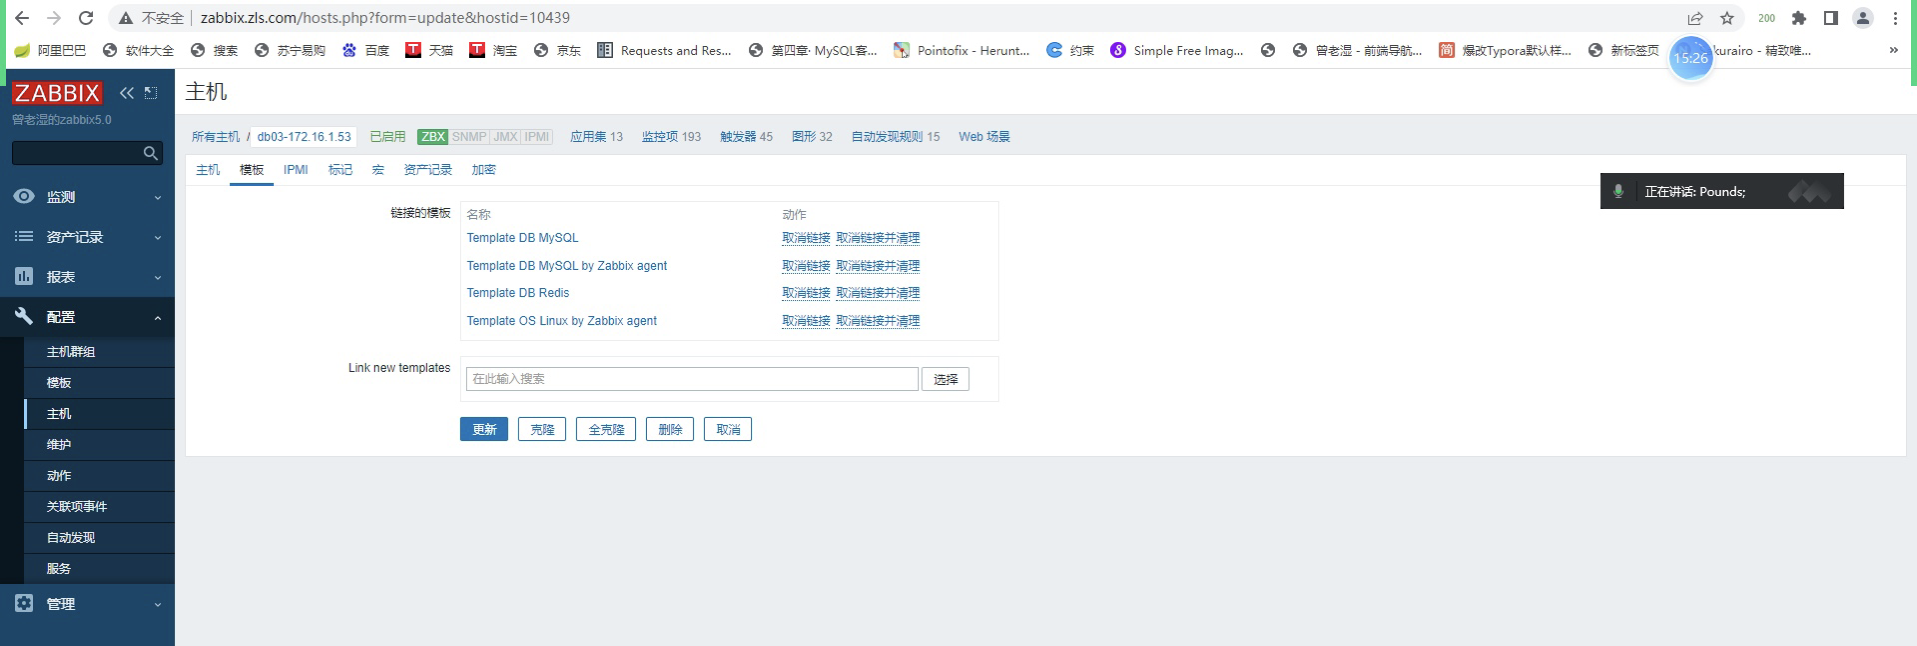
zabbix监控MySQL
zabbix监控redis 1 2 3 4 5 [root@db03 ~] [root@db03 ~]
Zabbix监控MySQL percona Monitoring Plugins是一个高质量的组件,为MySQL数据库添加企业级的监控和图表功能。但其脚本使用PHP实现,故而Zabbix-Agent需要安装PHP环境。
percona工具集
实践环境
服务器系统
角色
IP
CentOS 7.4 x86_64
Zabbix-Server
10.0.0.8
CentOS 7.4 x86_64
Zabbix-Agent
10.0.0.7
1.在Zabbix-Agent端安装percona Monitoring Plugins
1 2 [root@Agent ~] [root@Agent ~]
2.查看percona安装后的目录结构
1 2 3 4 5 6 7 8 [root@Agent percona] /var/lib/zabbix/percona ├── scripts │ ├── get_mysql_stats_wrapper.sh │ └── ss_get_mysql_stats.php └── templates ├── userparameter_percona_mysql.conf └── zabbix_agent_template_percona_mysql_server_ht_2.0.9-sver1.1.6.xml
4.将自定义监控项配置文件复制至/etc/zabbix_agentd.conf.d目录下
5.重启zabbix-agent
6.修改脚本中的MySQL用户名和密码
1 2 3 4 [root@Agent scripts] $mysql_user = 'root' ;$mysql_pass = '123' ;$mysql_port = 3306;
7.在Zabbix-Server端上使用Zabbix_get获取值(否则会失败)
1 2 3 4 5 6 7 8 [root@Server ~] 223003813 //如果获取不到值常见问题 1.看是否是MySQL密码错误 2.不要直接执行脚本来获取 3.删除/tmp/localhost-mysql_cacti_stats.txt文件 4.权限问题导致
8.在Zabbix页面模板选项中导入Percona模板, 模板存放在/var/lib/zabbix/percona/templates, 最后关联主机即可。
Zabbix监控Redis Redis使用自带的INFO命令,进行状态监控。以一种易于解释且易于阅读的格式,返回关于Redis服务器的各种信息和统计数值。
实践环境
服务器系统
角色
IP
CentOS 7.4 x86_64
Zabbix-Server
10.0.0.8
CentOS 7.4 x86_64
Zabbix-Agent
10.0.0.7
1.编写Shell脚本
脚本端口、连接redis服务地址根据具体情况进行修改
AUTH认证没有开启,将PASSWD修改为空即可。
1 2 3 4 5 6 7 8 9 10 11 12 13 14 15 16 17 18 19 20 21 22 23 24 25 26 27 28 29 30 31 32 33 34 35 36 37 38 39 40 41 42 43 44 45 46 47 48 49 50 51 52 53 54 55 56 57 58 59 60 61 62 63 64 65 66 67 68 69 70 71 72 73 74 75 76 77 78 79 80 81 82 83 84 85 86 87 88 89 90 91 92 93 94 95 [root@Agent ~] [root@Agent ~] #!/bin/bash R_COMMAND="$1 " R_PORT="6379" R_SERVER="127.0.0.1" PASSWD="" redis_status (echo -en "AUTH $PASSWD \r\nINFO\r\n" ;sleep 1;) | /usr/bin/nc "$R_SERVER " "$R_PORT " > /tmp/redis_"$R_PORT " .tmp REDIS_STAT_VALUE=$(grep "$R_COMMAND :" /tmp/redis_"$R_PORT " .tmp | cut -d ':' -f2) echo "$REDIS_STAT_VALUE " } case $R_COMMAND in used_cpu_user_children) redis_status "$R_PORT " "$R_COMMAND " ;; used_cpu_sys) redis_status "$R_PORT " "$R_COMMAND " ;; total_commands_processed) redis_status "$R_PORT " "$R_COMMAND " ;; role) redis_status "$R_PORT " "$R_COMMAND " ;; lru_clock) redis_status "$R_PORT " "$R_COMMAND " ;; latest_fork_usec) redis_status "$R_PORT " "$R_COMMAND " ;; keyspace_misses) redis_status "$R_PORT " "$R_COMMAND " ;; keyspace_hits) redis_status "$R_PORT " "$R_COMMAND " ;; keys) redis_status "$R_PORT " "$R_COMMAND " ;; expires) redis_status "$R_PORT " "$R_COMMAND " ;; expired_keys) redis_status "$R_PORT " "$R_COMMAND " ;; evicted_keys) redis_status "$R_PORT " "$R_COMMAND " ;; connected_clients) redis_status "$R_PORT " "$R_COMMAND " ;; changes_since_last_save) redis_status "$R_PORT " "$R_COMMAND " ;; blocked_clients) redis_status "$R_PORT " "$R_COMMAND " ;; bgsave_in_progress) redis_status "$R_PORT " "$R_COMMAND " ;; bgrewriteaof_in_progress) redis_status "$R_PORT " "$R_COMMAND " ;; used_memory_peak) redis_status "$R_PORT " "$R_COMMAND " ;; used_memory) redis_status "$R_PORT " "$R_COMMAND " ;; used_cpu_user) redis_status "$R_PORT " "$R_COMMAND " ;; used_cpu_sys_children) redis_status "$R_PORT " "$R_COMMAND " ;; total_connections_received) redis_status "$R_PORT " "$R_COMMAND " ;; *) echo $"USAGE:$0 {used_cpu_user_children|used_cpu_sys|total_commands_processed|role|lru_clock|latest_fork_usec|keyspace_misses|keyspace_hits|keys|expires|expired_keys|connected_clients|changes_since_last_save|blocked_clients|bgrewriteaof_in_progress|used_memory_peak|used_memory|used_cpu_user|used_cpu_sys_children|total_connections_received}" esac
Redis状态参数解释:
1 2 3 4 5 6 7 8 9 10 11 12 13 14 15 16 17 18 19 20 21 22 23 24 25 26 27 28 29 30 31 32 33 34 35 36 37 38 server : Redis 服务器信息,包含以下域: redis_version : Redis 服务器版本 redis_git_sha1 : Git SHA1 redis_git_dirty : Git dirty flag os : Redis 服务器的宿主操作系统 arch_bits : 架构(32 或 64 位) multiplexing_api : Redis 所使用的事件处理机制 gcc_version : 编译 Redis 时所使用的 GCC 版本 process_id : 服务器进程的 PID run_id : Redis 服务器的随机标识符(用于 Sentinel 和集群) tcp_port : TCP/IP 监听端口 uptime_in_seconds : 自 Redis 服务器启动以来,经过的秒数 uptime_in_days : 自 Redis 服务器启动以来,经过的天数 lru_clock : 以分钟为单位进行自增的时钟,用于 LRU 管理 clients : 已连接客户端信息,包含以下域: connected_clients : 已连接客户端的数量(不包括通过从属服务器连接的客户端) client_longest_output_list : 当前连接的客户端当中,最长的输出列表 client_longest_input_buf : 当前连接的客户端当中,最大输入缓存 blocked_clients : 正在等待阻塞命令(BLPOP、BRPOP、BRPOPLPUSH)的客户端的数量 memory : 内存信息,包含以下域: used_memory : 由 Redis 分配器分配的内存总量,以字节(byte)为单位 used_memory_human : 以人类可读的格式返回 Redis 分配的内存总量 used_memory_rss : 从操作系统的角度,返回 Redis 已分配的内存总量(俗称常驻集大小)。这个值和 top 、 ps 等命令的输出一致。 used_memory_peak : Redis 的内存消耗峰值(以字节为单位) used_memory_peak_human : 以人类可读的格式返回 Redis 的内存消耗峰值 used_memory_lua : Lua 引擎所使用的内存大小(以字节为单位) mem_fragmentation_ratio : used_memory_rss 和 used_memory 之间的比率 persistence : RDB 和 AOF 的相关信息 stats : 一般统计信息 replication : 主/从复制信息 cpu : CPU 计算量统计信息 commandstats : Redis 命令统计信息 cluster : Redis 集群信息 keyspace : 数据库相关的统计信息 参数还可以是下面这两个: all : 返回所有信息 default : 返回默认选择的信息 当不带参数直接调用 INFO 命令时,使用 default 作为默认参数。
3.添加脚本执行权限
4.Zabbix权限不足处理办法
5.key的redis_status.conf的配置文件如下:
1 2 [root@Agent ~] UserParameter=redis_status[*],/bin/bash /etc/zabbix/scripts/redis_status.sh "$1 "
6.重启zabbix-agent
7.在Zabbix-Server使用Zabbix_get获取值
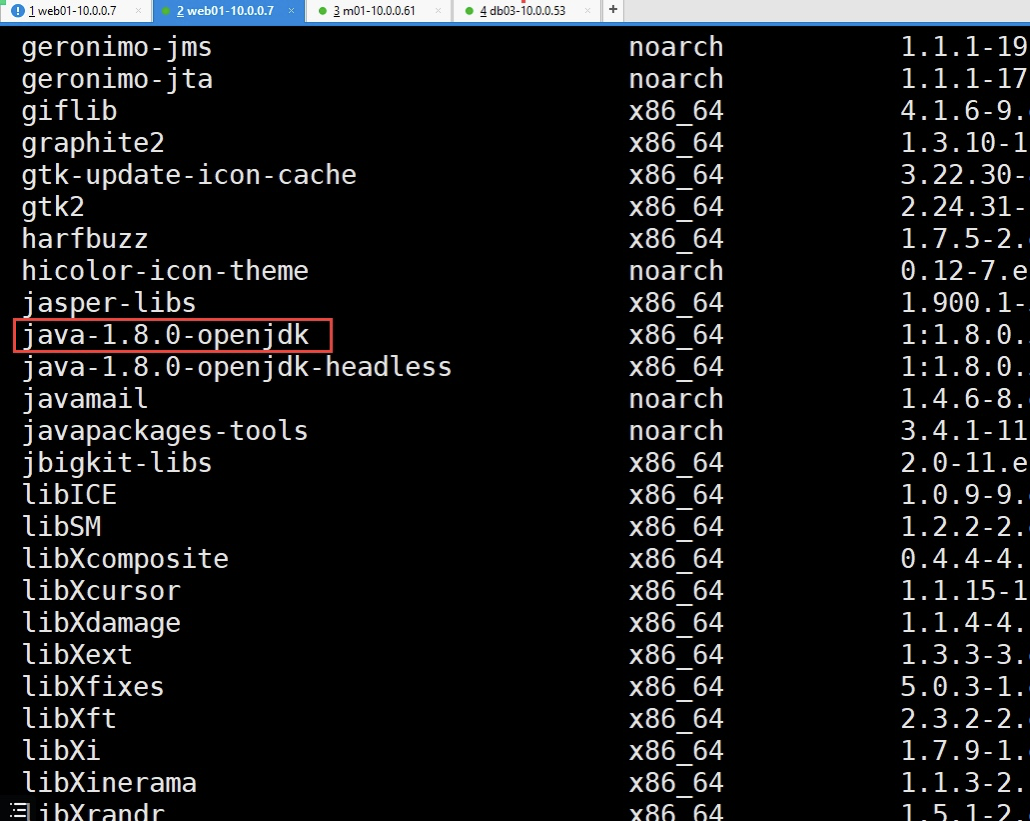
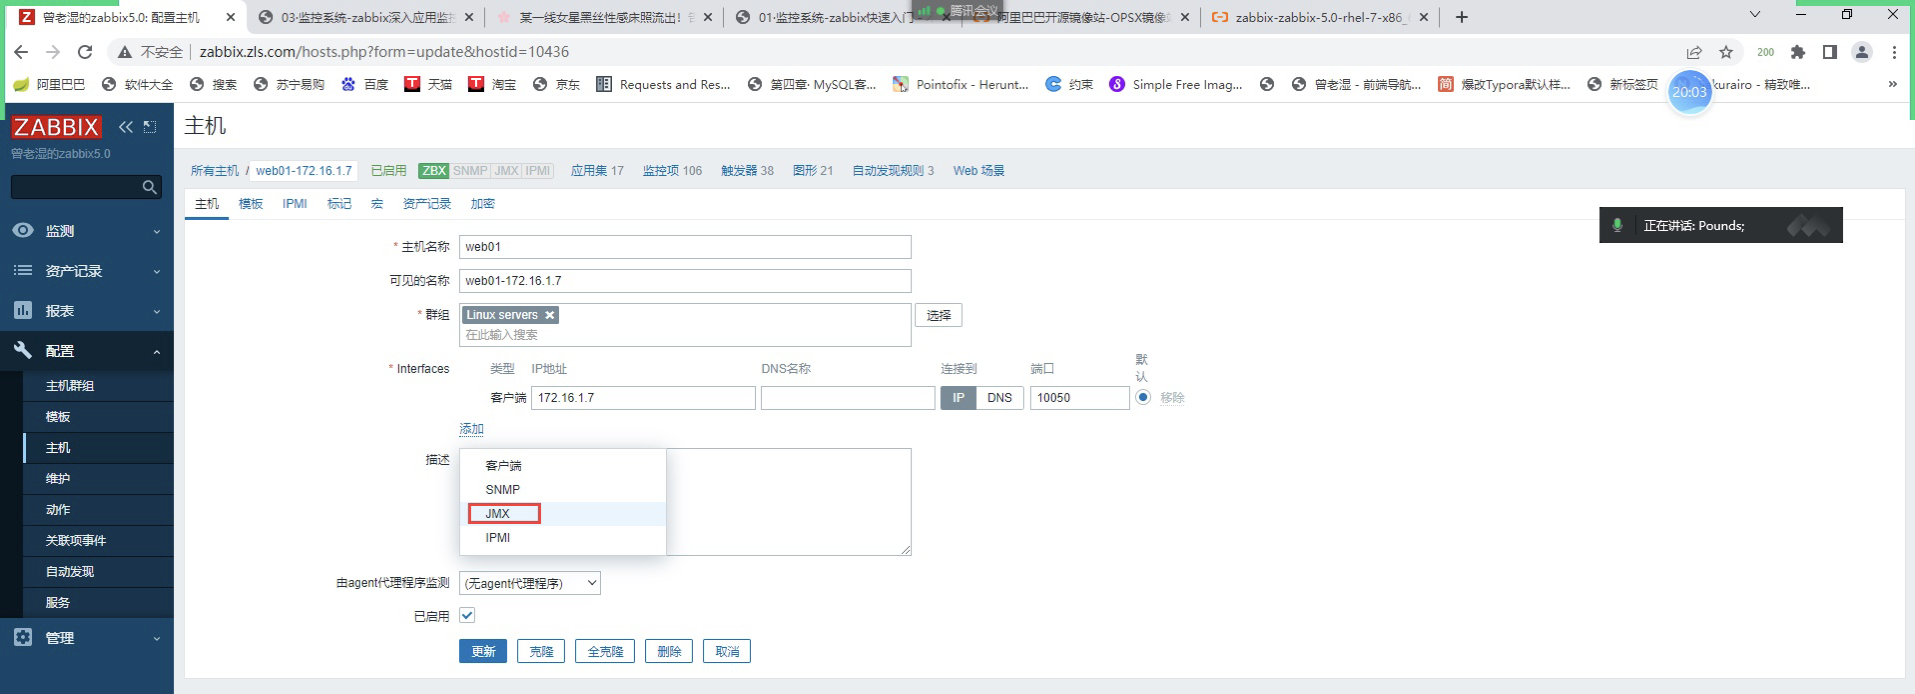
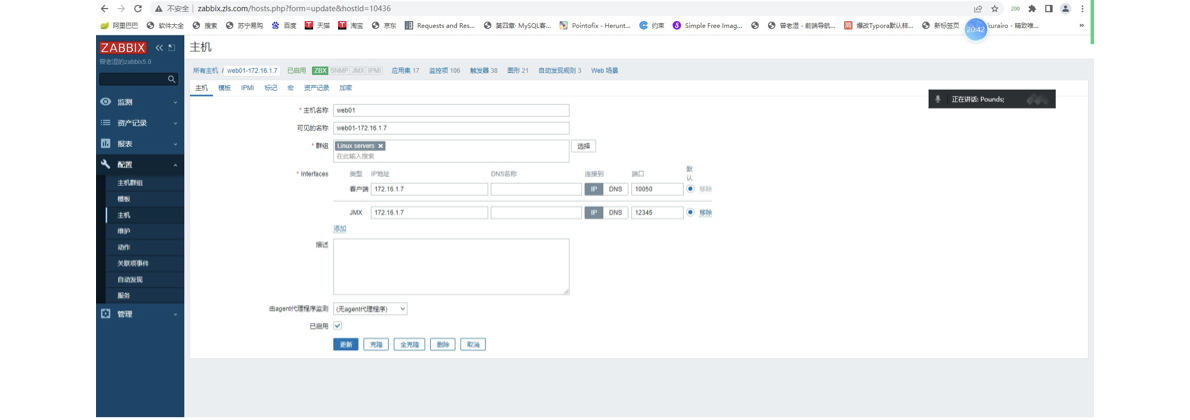
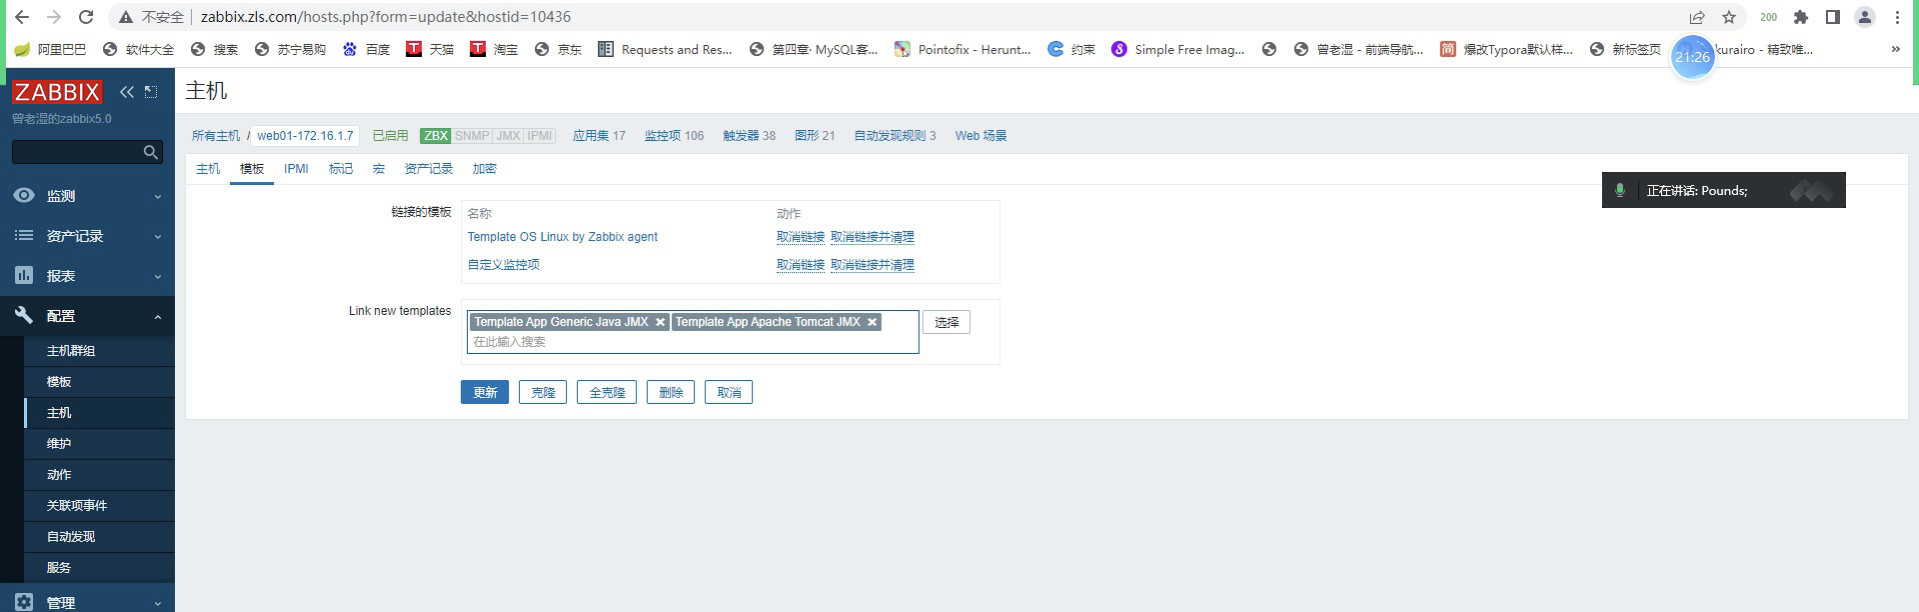
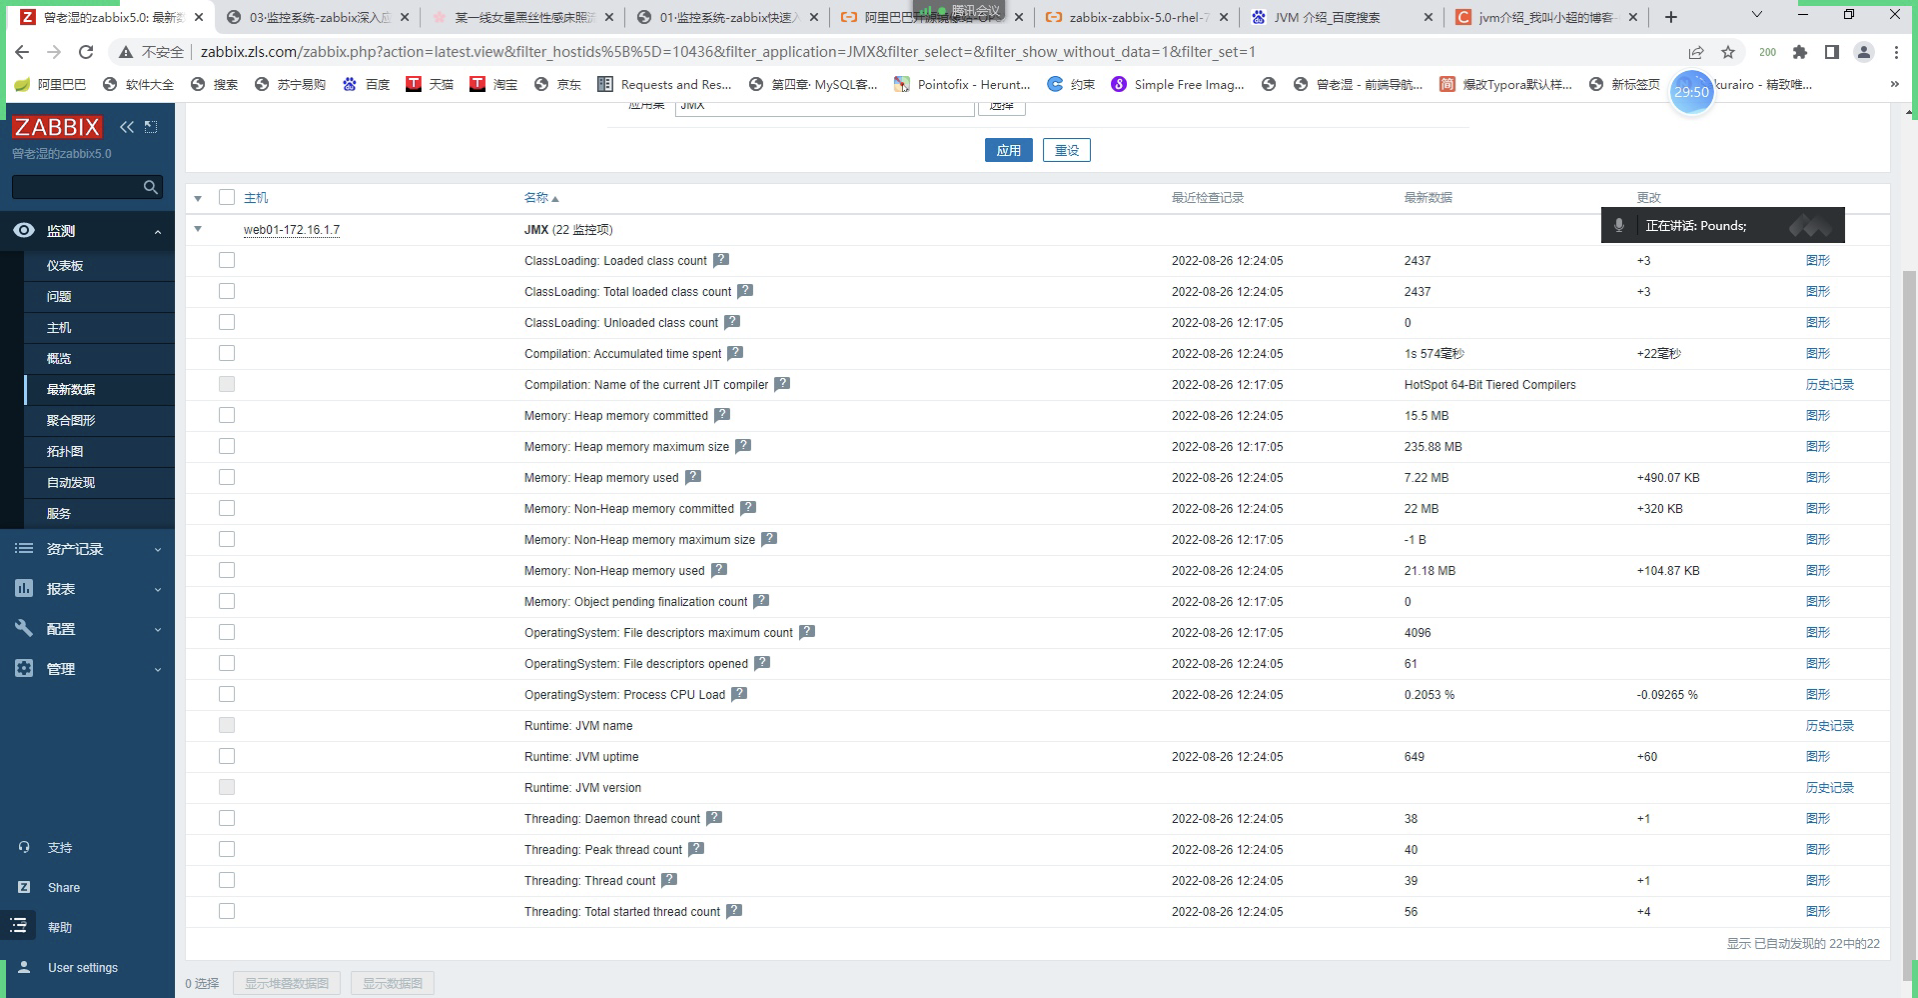
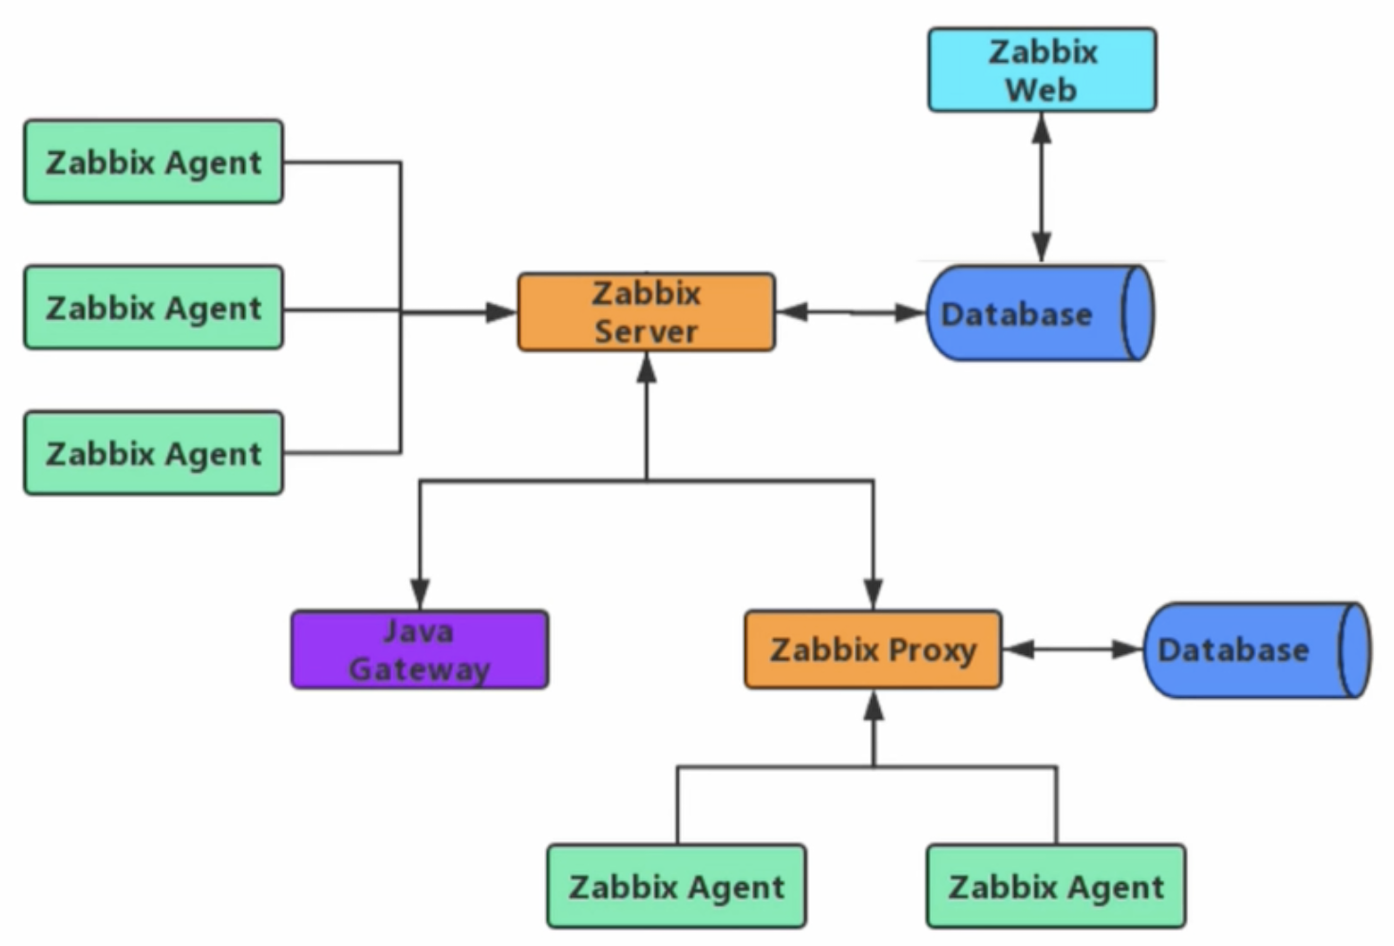
zabbix监控JVM(JAVA) 在Zabbix中,JMX监控数据的获取由专门的代理程序来实现,即Zabbix-Java-Gateway来负责数据的采集,Zabbix-Java-Gateway和JMX的Java程序之间通信获取数据.
JMX在zabbix中运行的流程 1 2 3 4 5 1.Zabbix-Server找Zabbix-Java-Gateway获取Java数据 2.Zabbix-Java-Gateway找Java程序获取数据 3.Java程序返回数据给Zabbix-Java-Gateway 4.Zabbix-Java-Gateway返回数据给Zabbix-Server 5.Zabbix-Server进行数据展示
JMX监控配置步骤
1 2 3 4 5 1.安装Zabbix-Java-Gateway。 2.配置zabbix_java_gateway.conf参数。 3.配置zabbix-server.conf参数。 4.Tomcat应用开启JMX协议。 5.ZabbixWeb配置JMX监控的Java应用。
1 2 3 4 5 6 7 8 9 10 11 12 13 14 15 16 17 18 19 20 21 22 23 24 25 26 27 28 29 30 31 32 33 34 zabbix-java-gateway [root@web01 ~] [root@web01 ~] [root@web01 ~] [root@web01 ~] [root@web01 ~] tcp6 0 0 :::10052 :::* LISTEN 85993/java [root@sb_wzj ~] JavaGateway=172.16.1.7 JavaGatewayPort=10052 StartJavaPollers=5 [root@sb_wzj ~] [root@web01 ~] CATALINA_OPTS="$CATALINA_OPTS -Dcom.sun.management.jmxremote -Dcom.sun.management.jmxremote.port=12345 -Dcom.sun.management.jmxremote.authenticate=false -Dcom.sun.management.jmxremote.ssl=false -Djava.rmi.server.hostname=172.16.1.7"
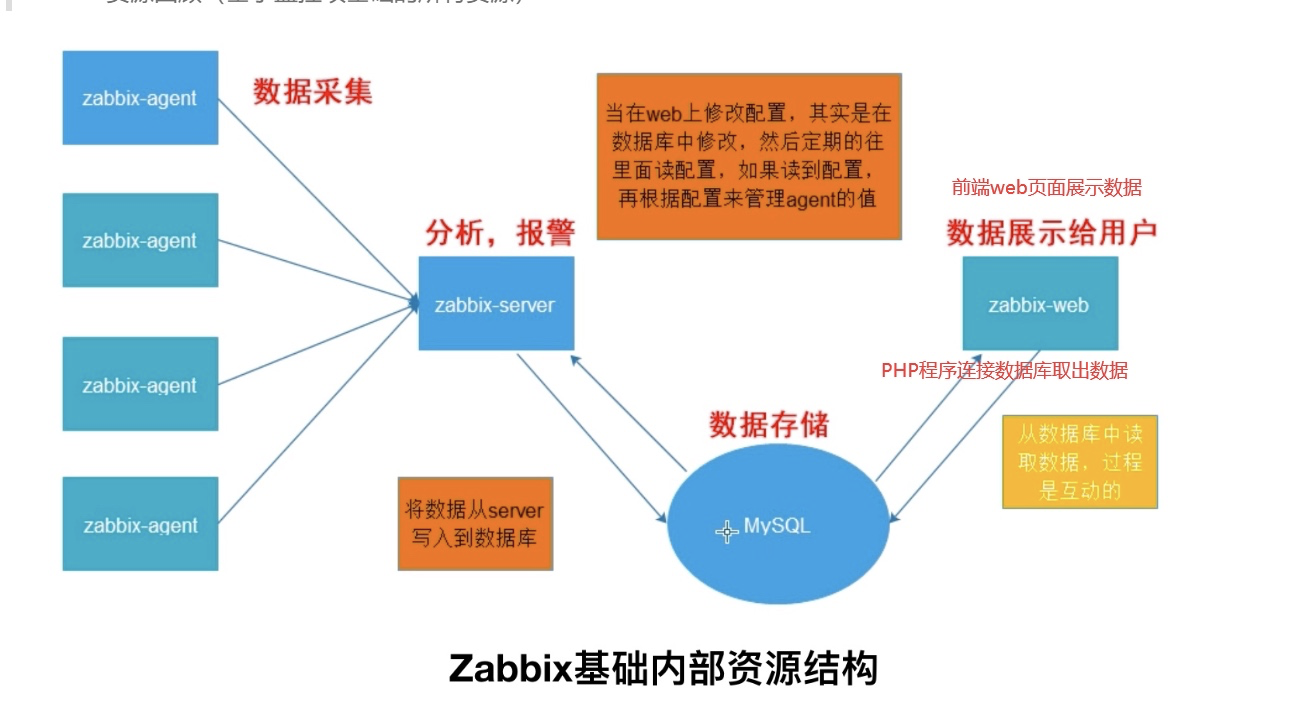
zabbix自定义监控阶段小结 zabbix监控基础架构回顾
Zabbix监控方式:
agent:客户端监控
SNMP:监控网络设备(交换机)
IPMI:监控主机硬件设备(Dell R710 R720 R730 远程管理卡)
JMX:监控JAVA的JVM
Zabbix资源回顾(基于监控项基础的所有资源)
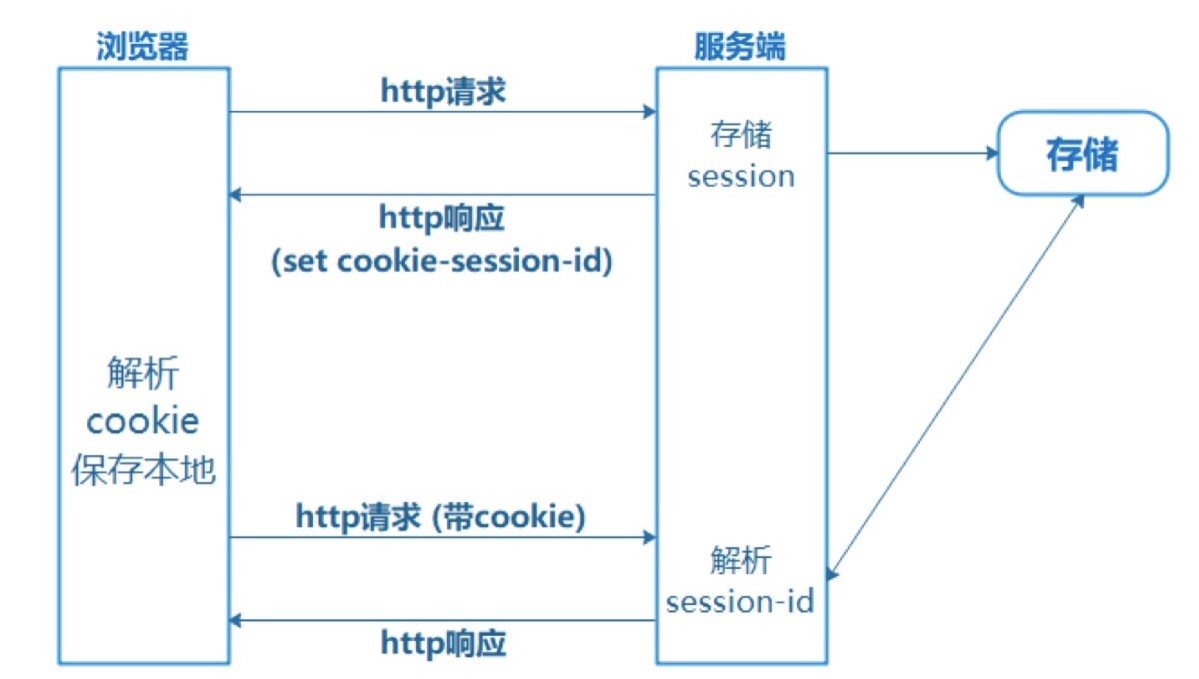
Zabbix Web检测 什么是静态网站、动态网站 静态网站:纯静态网站就是服务器的源代码和客户端的源代码一致。动态网站:比如: <?php phpinfo()?>每次用户访问的时候,内容都是在内存中动态生成的。动态网站支持登陆,支持用户交互,所以用户在请求动态网站时,会给客户端下发一个叫sessionID的内容,那么客户端则会将SessionID保存至浏览器的cookie中。
session和cookie的工作流程 1) 当用户首次访问动态网站时,是不会携带cookie信息,那么在服务端返回网页的时候,会给该客户端的浏览器分配一个唯一的sessionID,客户端会该sessionID存储至浏览器的Cookie中。
2) 当用户再次访问网站时,浏览器会在Header头信息添加Set-Cookie,Set-Cookie携带的则是该网站对应的sessionID信息,服务端接收后会进行校验
使用命令模拟用户登录网站 1 2 3 4 5 6 7 8 [root@web01 ~] [root@web01 ~] [root@web01 ~]
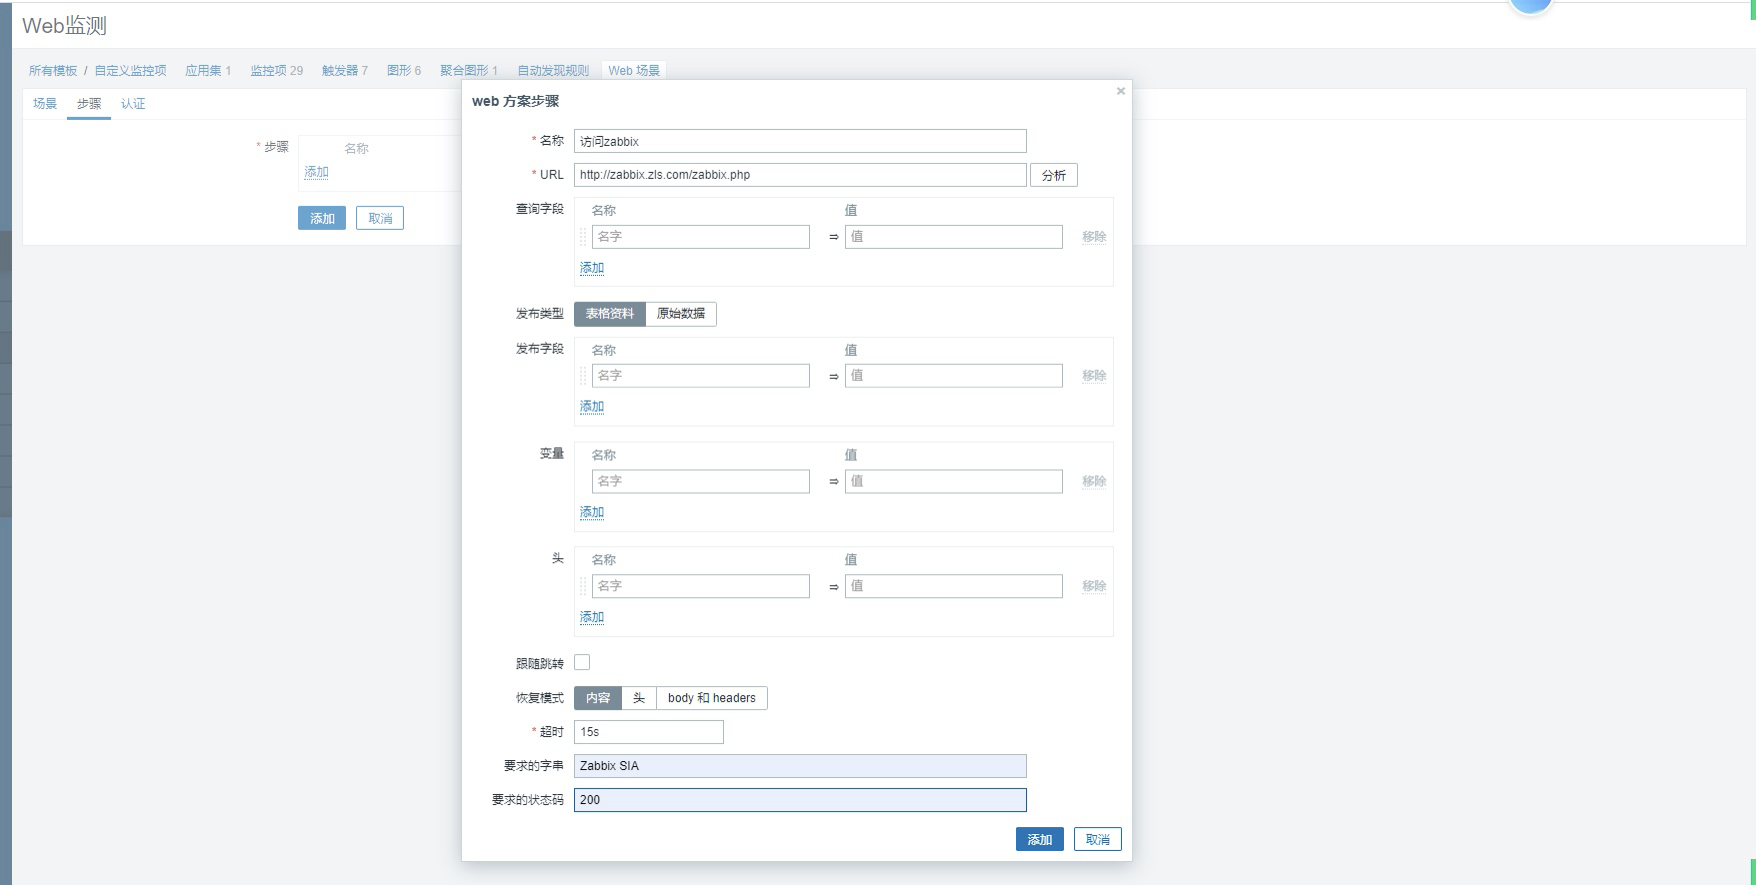
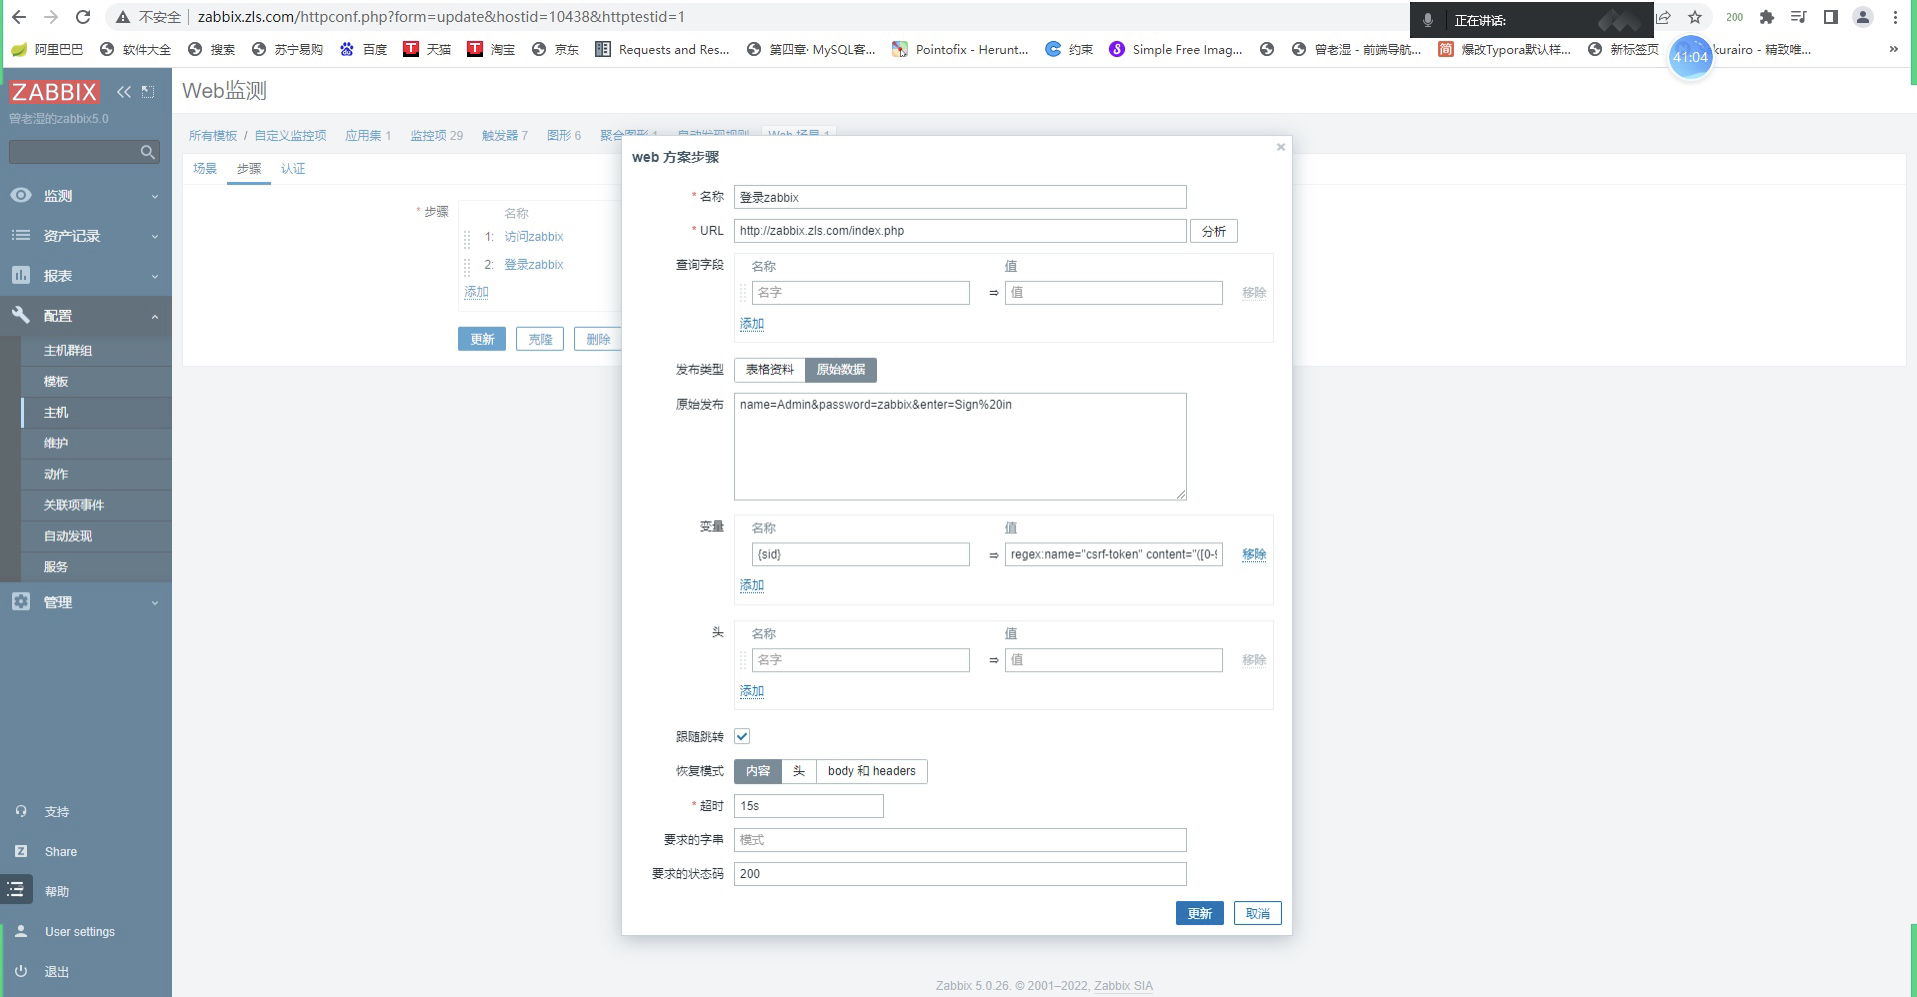
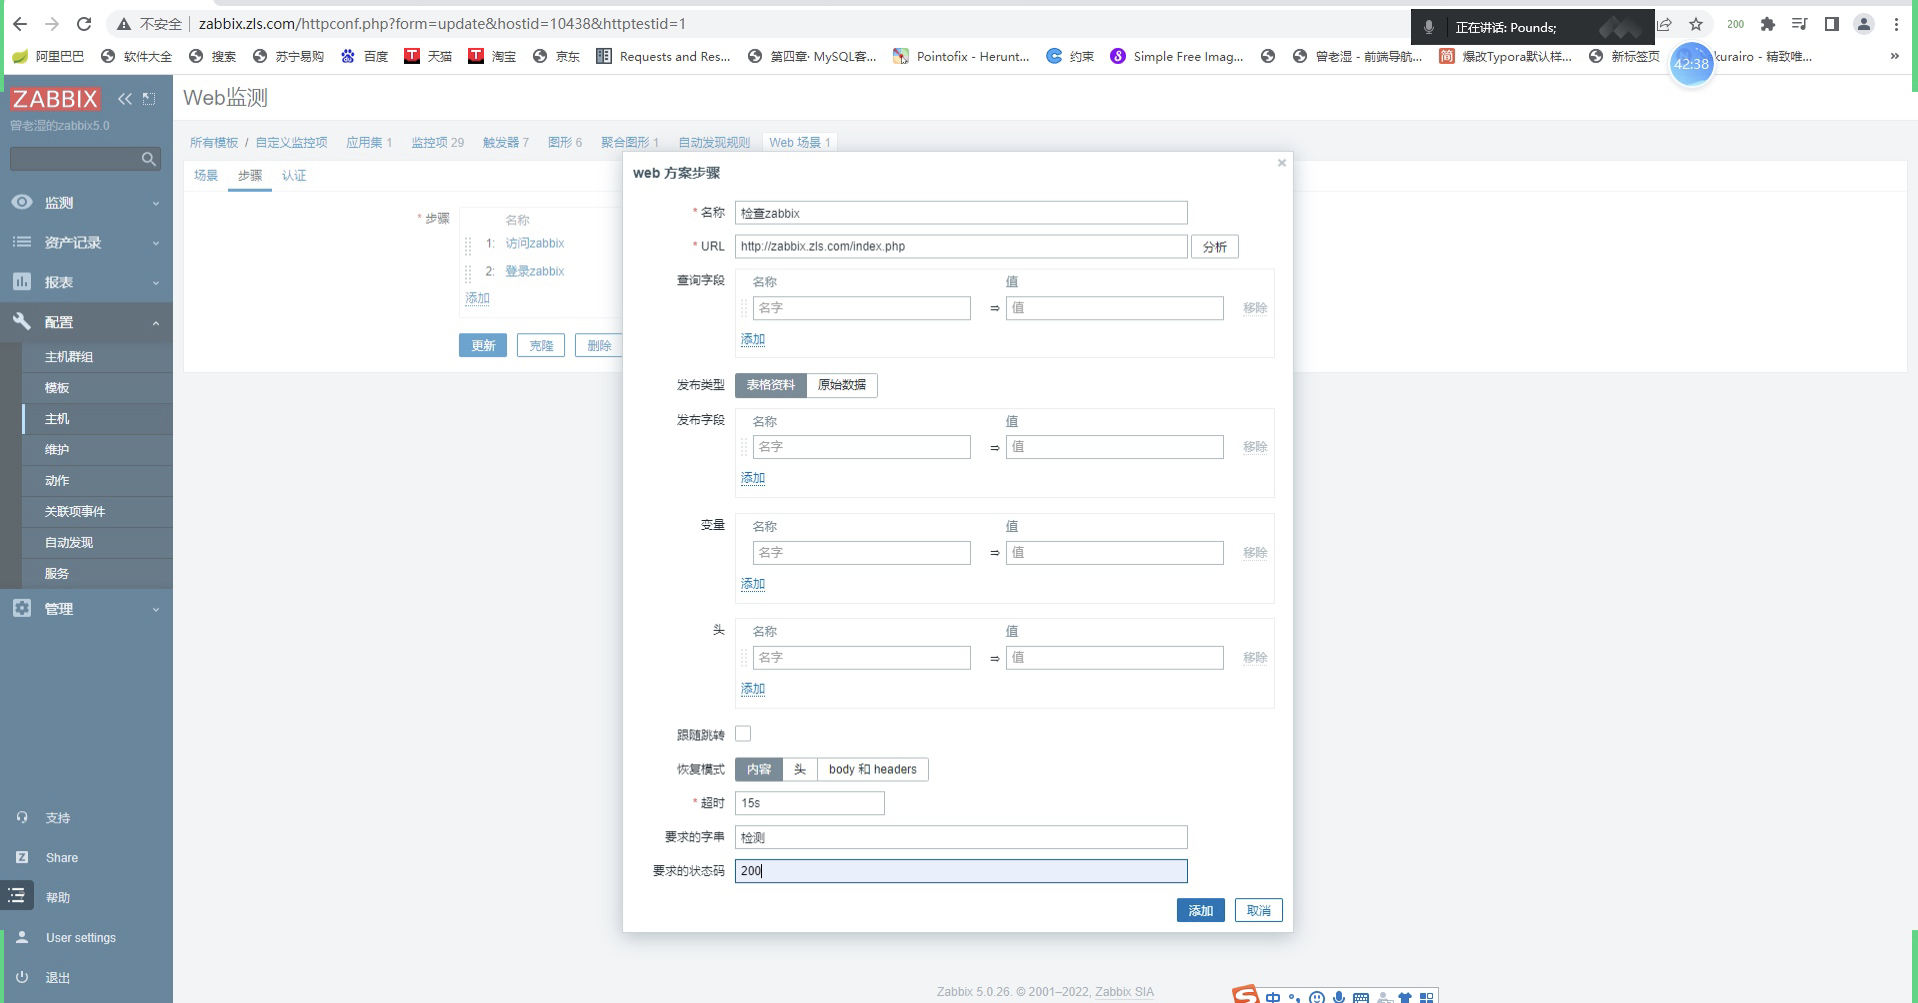
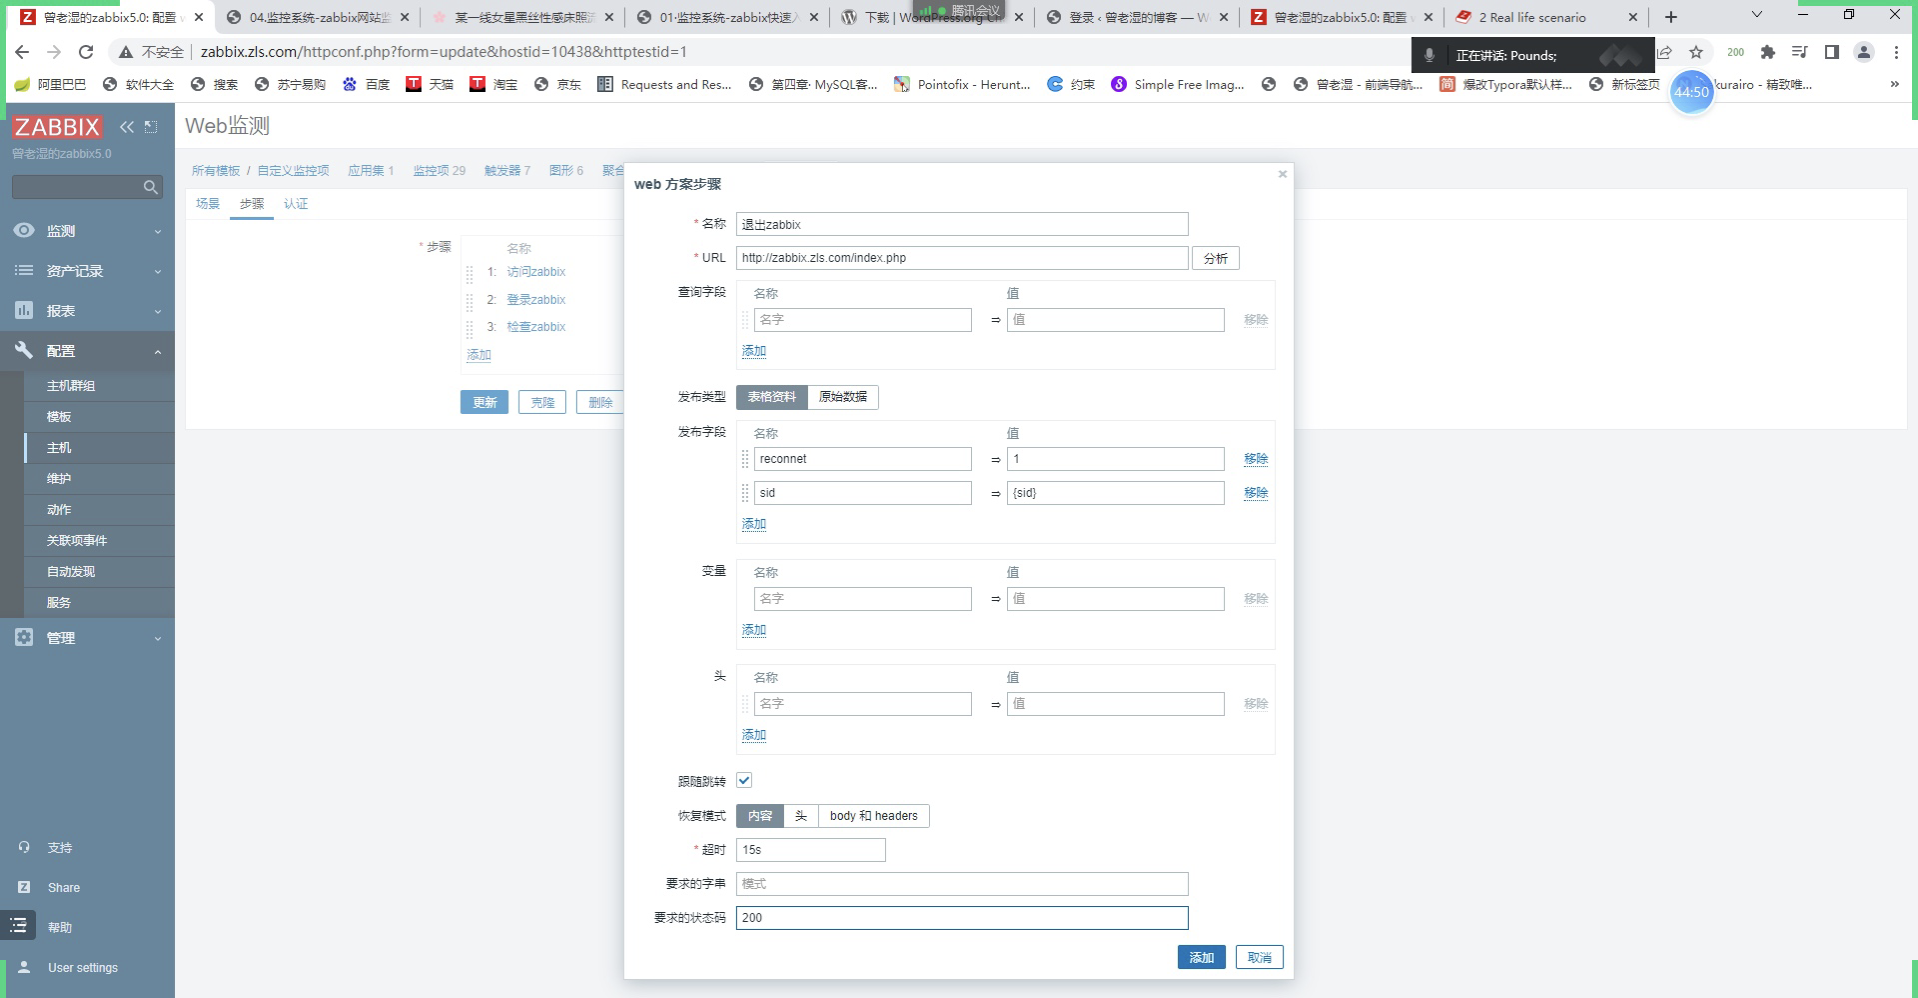
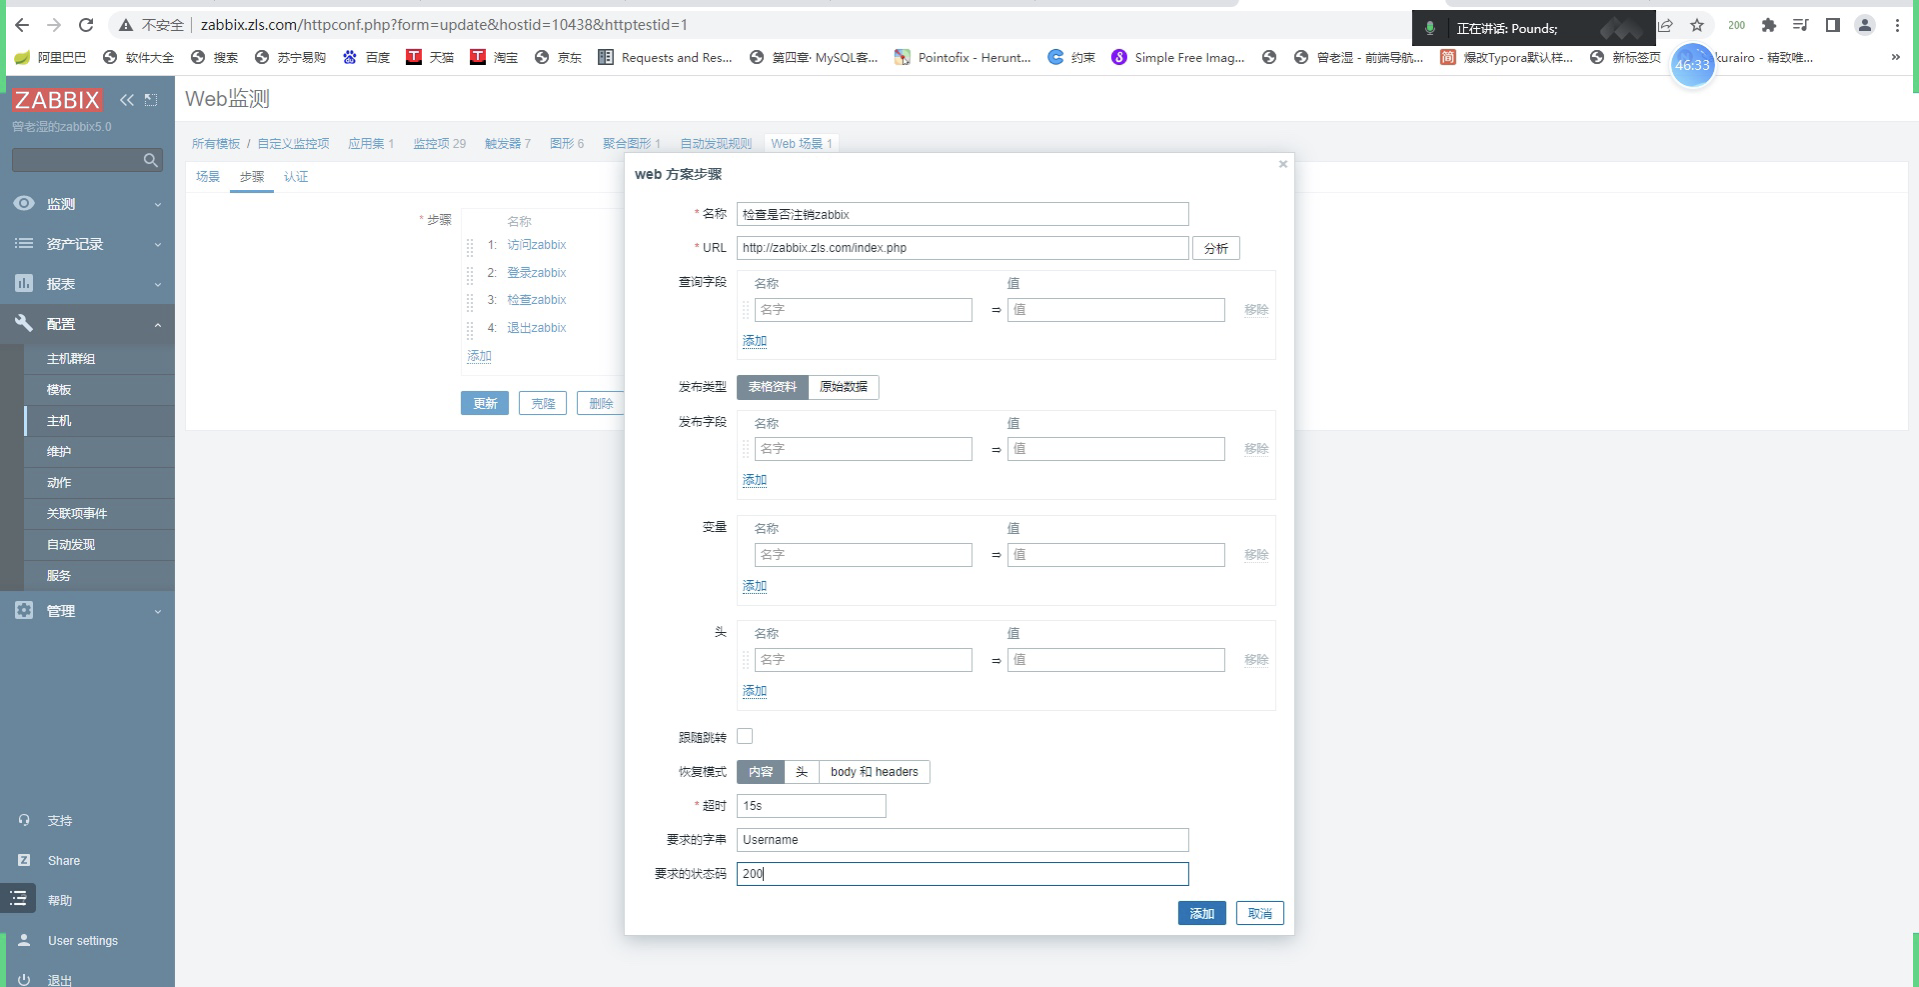
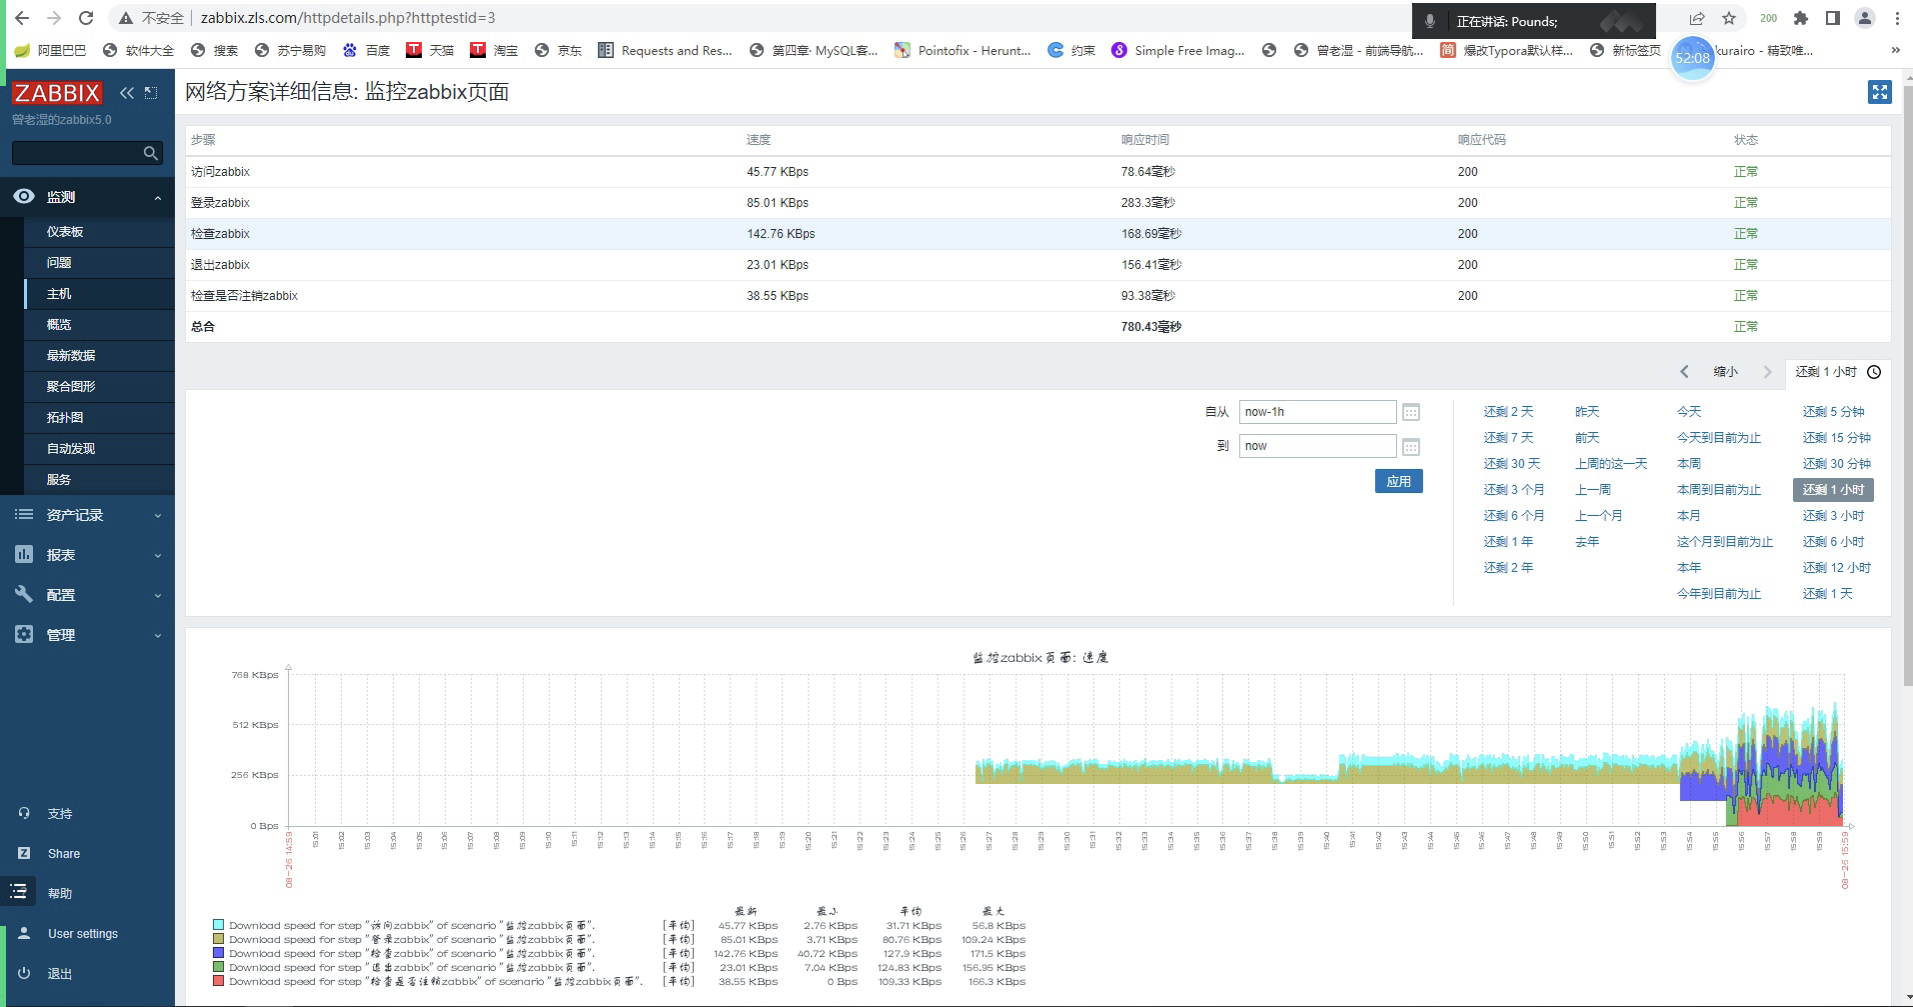
zabbix监控web网站 我们使用Zabbix Web 监控来监控Zabbix的Web界面。我们想知道它是否可用、是否正常工作以及响应速度。所以我们必须使用用户名和密码登录。
在新的场景中,我们将场景命名为”监控zabbix服务器”,并为其创建一个新的应用 (application )。
1 2 regex:name="csrf-token" content="([0-9a-z]{16})"
注意:一定要勾选跟随跳转
Zabbix自动化监控 zabbix工作模式
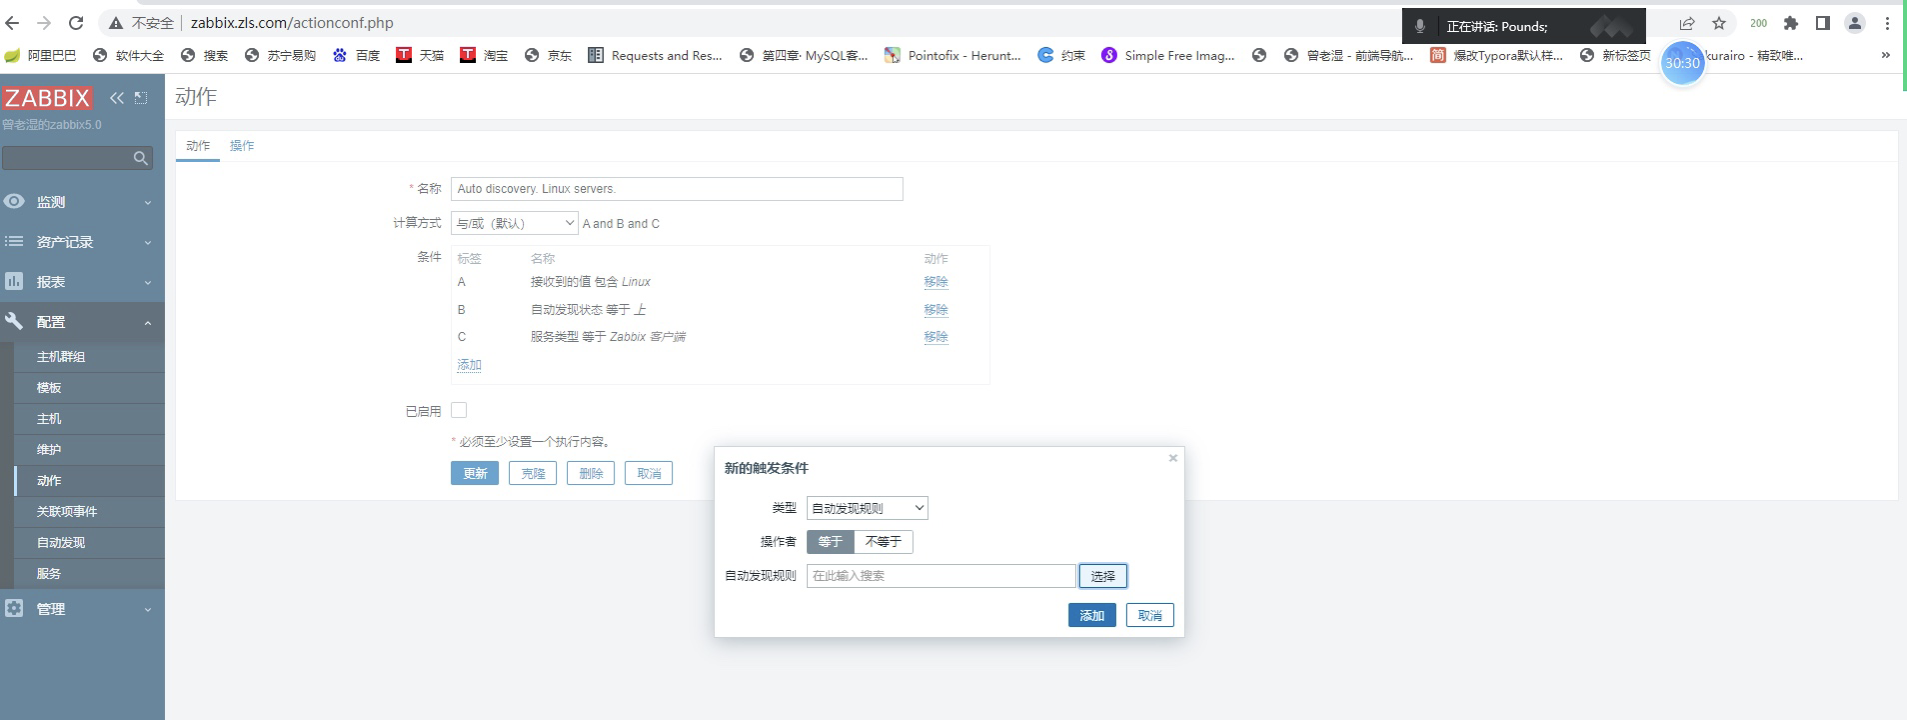
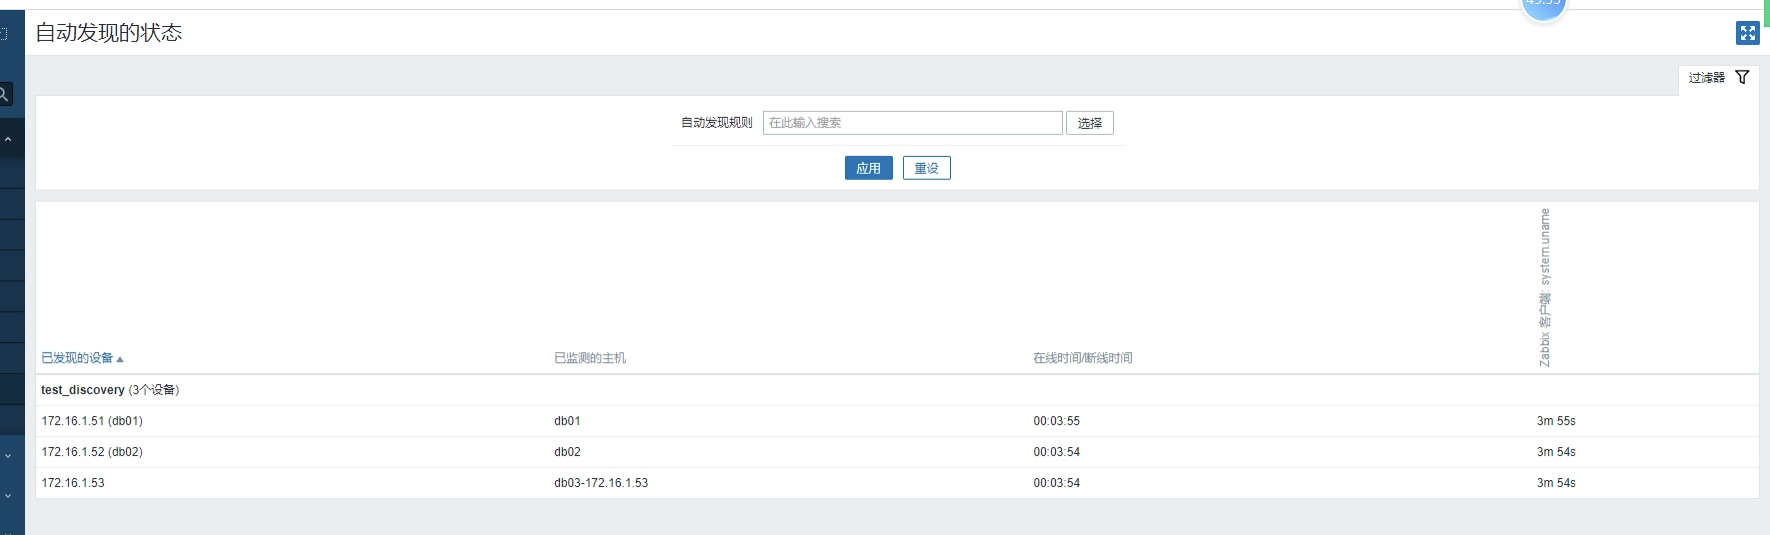
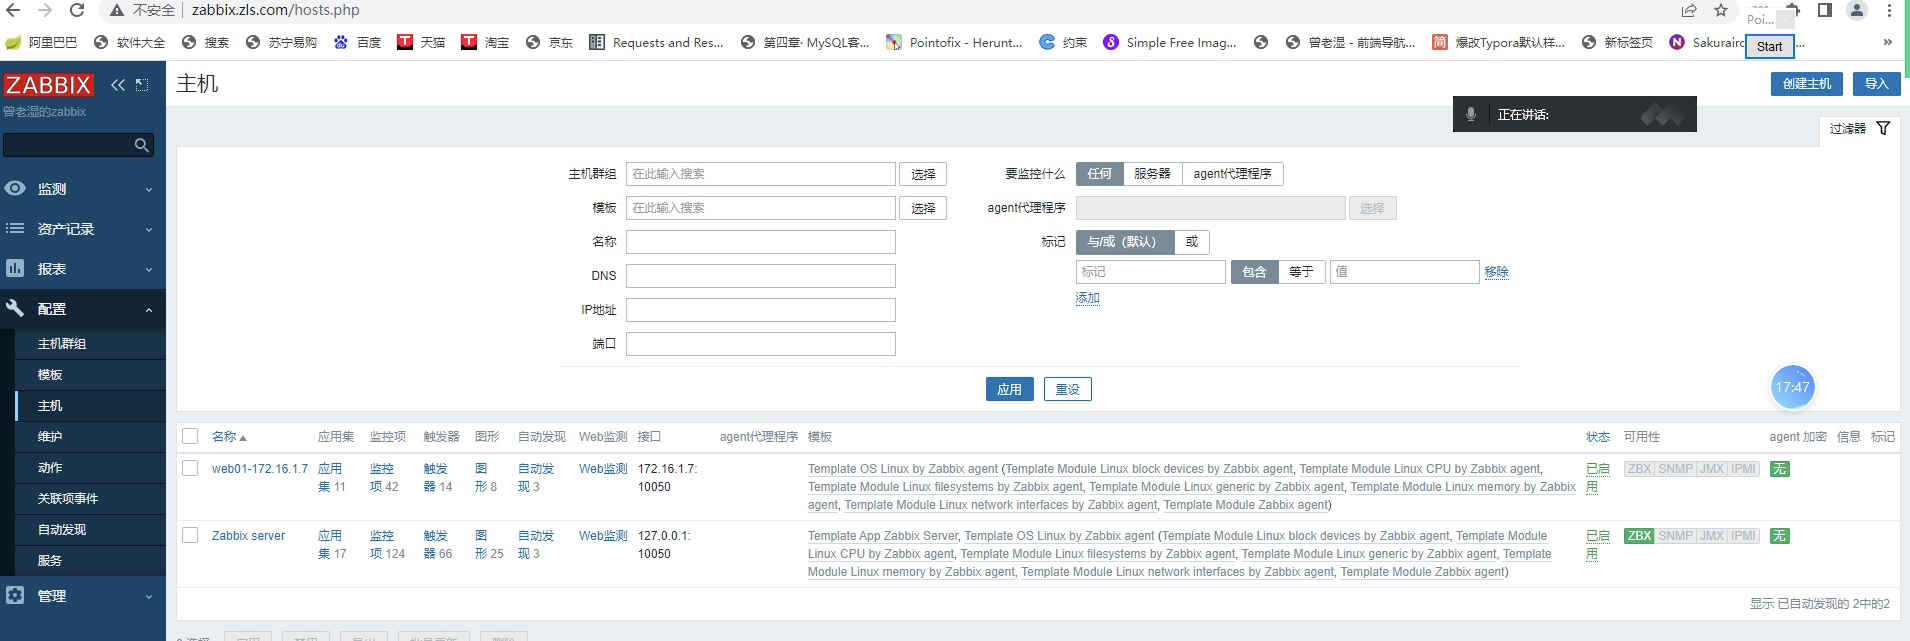
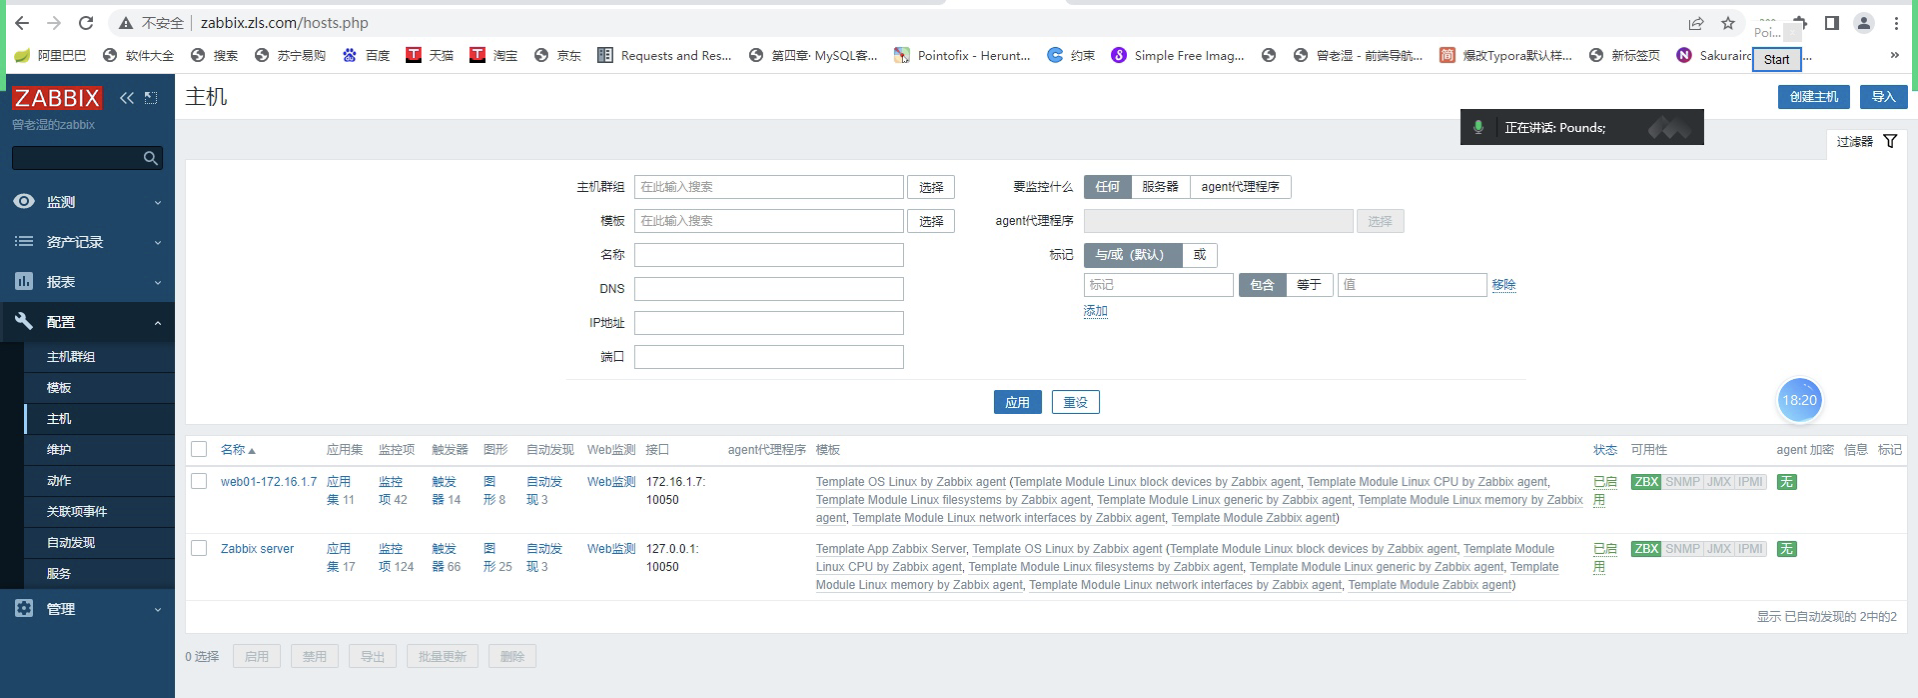
自动发现 zabbix的服务端,扫描IP网段,该网段上,只要安装了zabbix agent并且配置了服务端的IP,zabbix-server会自动将发现的主机加入到资产中。
当网络发现正确设置后你可以:
Zabbix网络发现基于以下信息:
不支持:
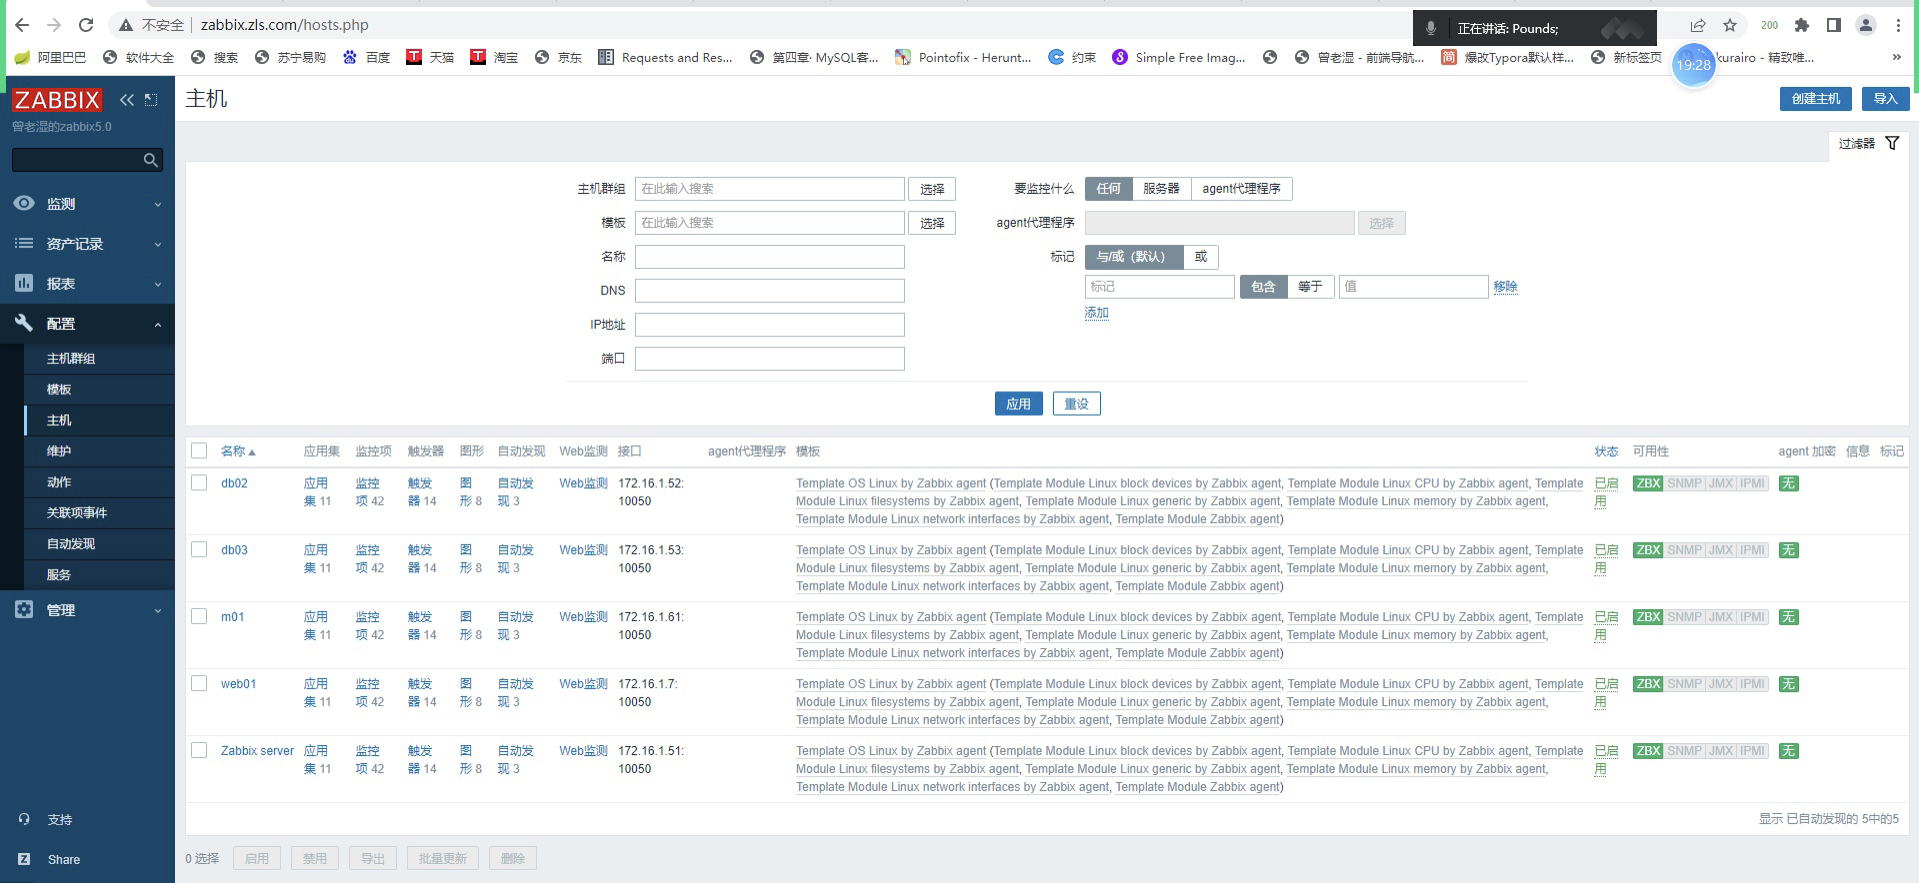
自动发现配置 1 2 3 4 5 6 7 8 9 rpm -ivh https://mirrors.aliyun.com/zabbix/zabbix/5.0/rhel/7/x86_64/zabbix-agent-5.0.26-1.el7.x86_64.rpm?spm=a2c6h.25603864.0.0.20ba2e2fnfcAbB [root@db02 ~] Server=172.16.1.61 [root@db02 ~]
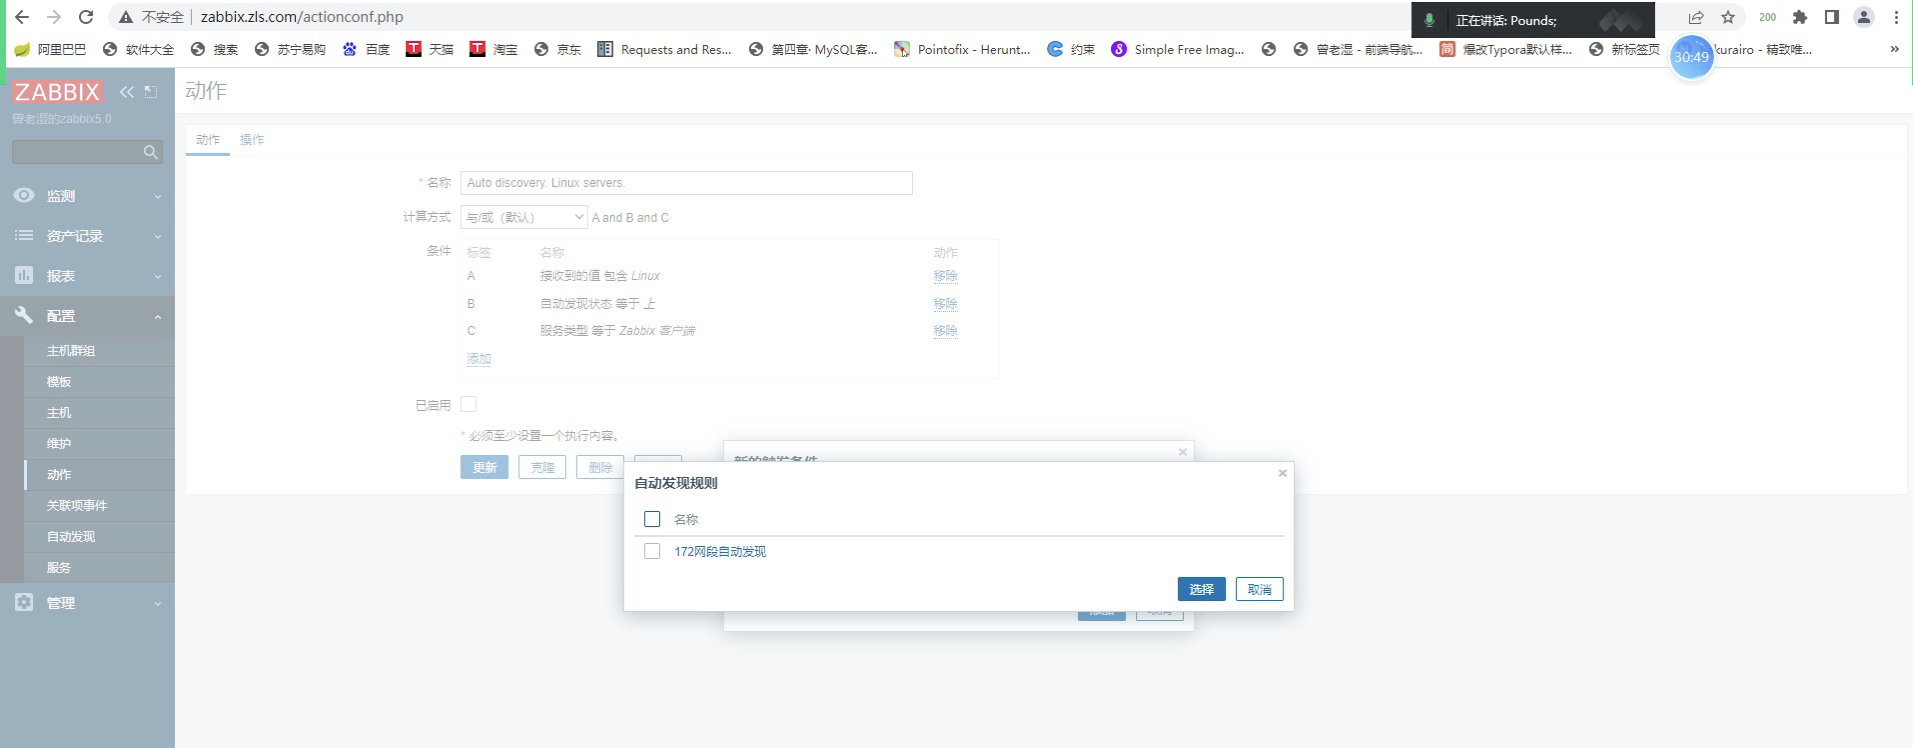
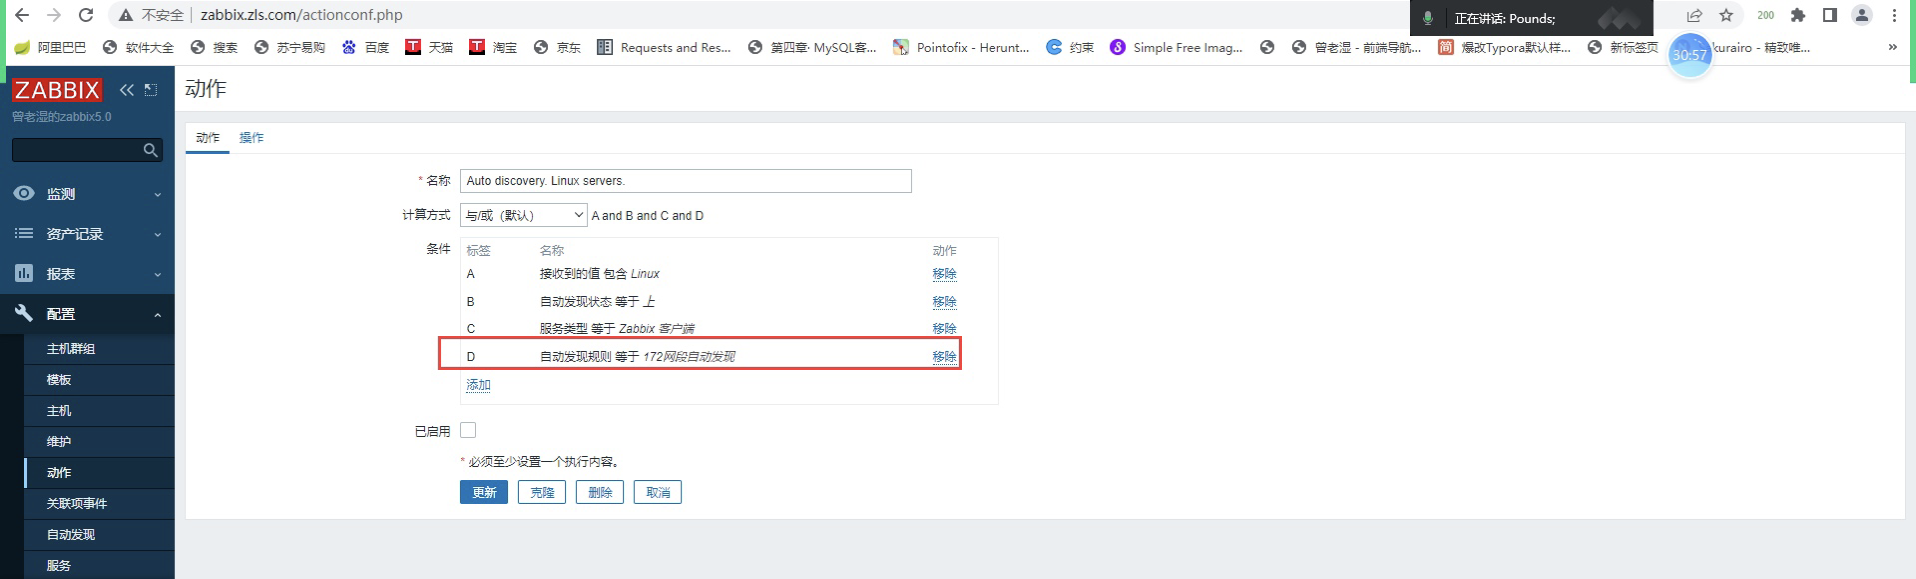
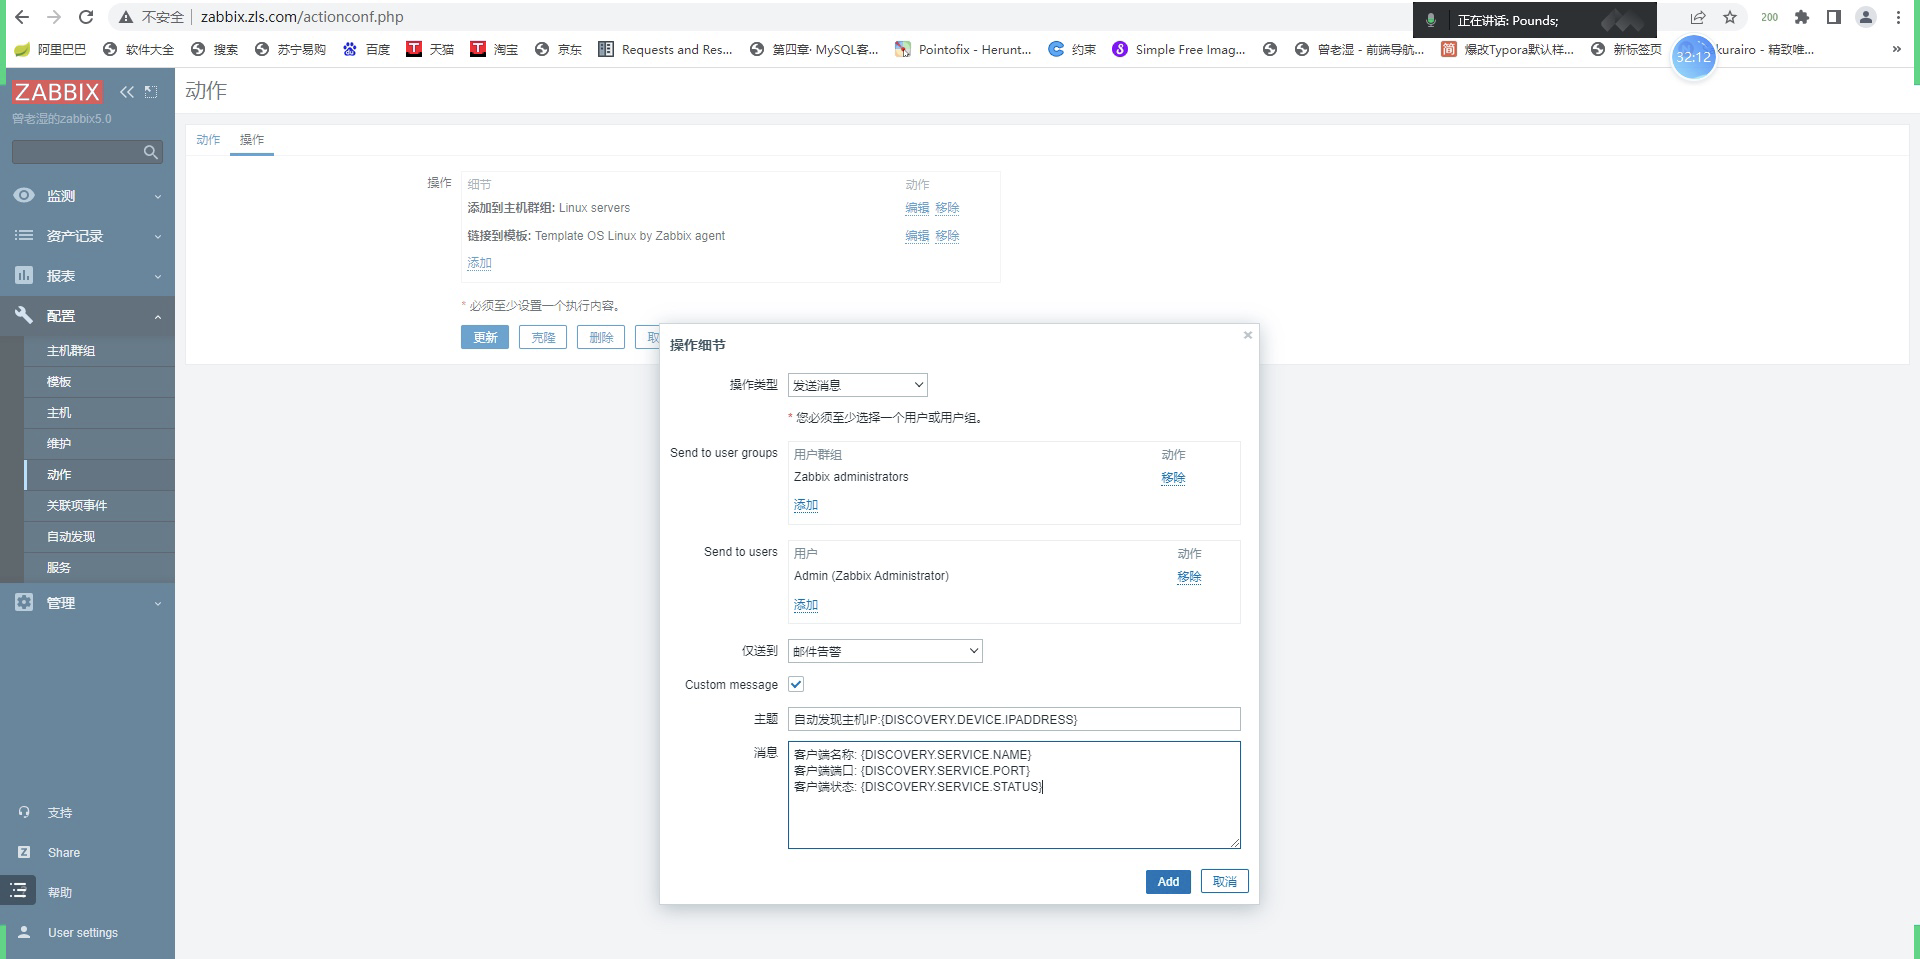
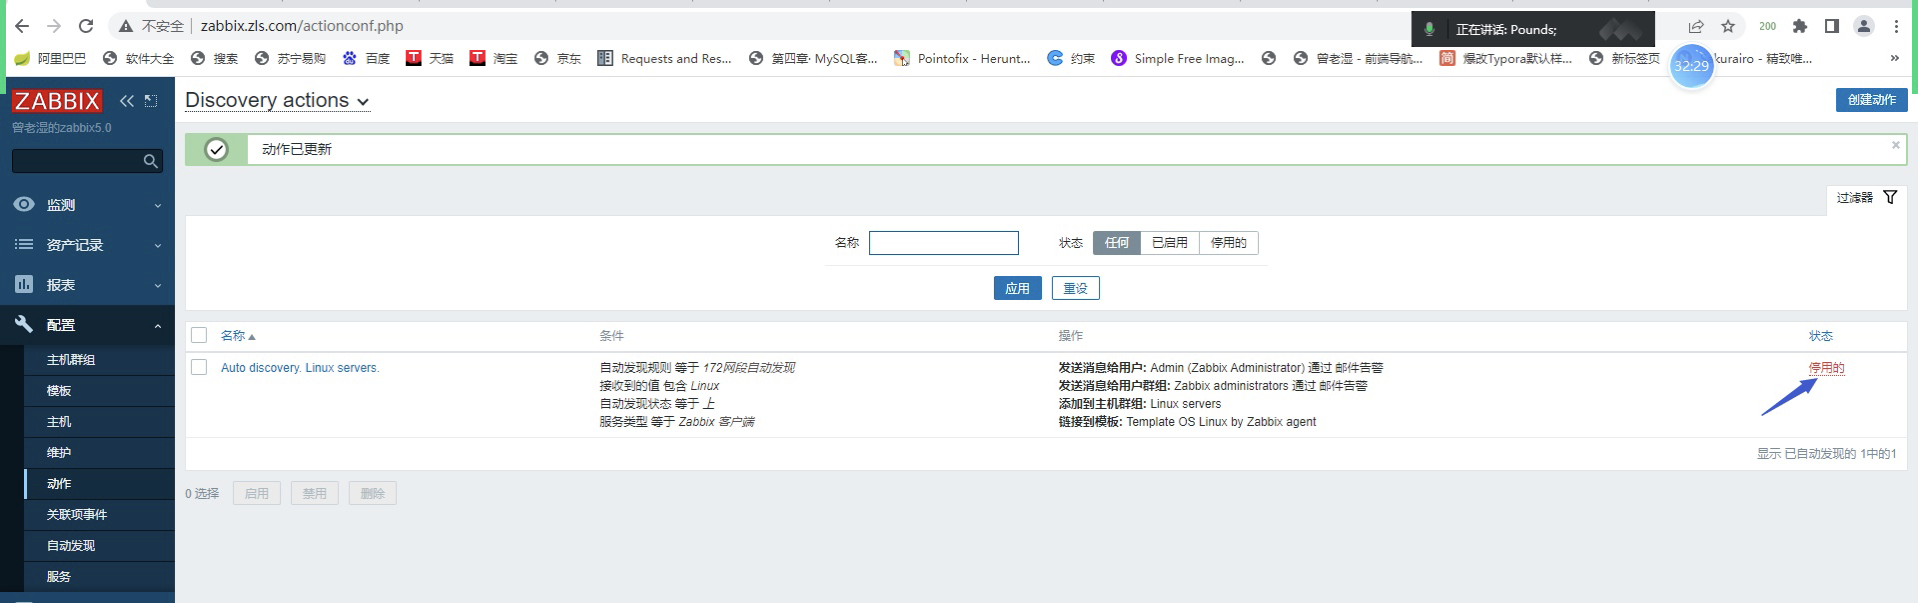
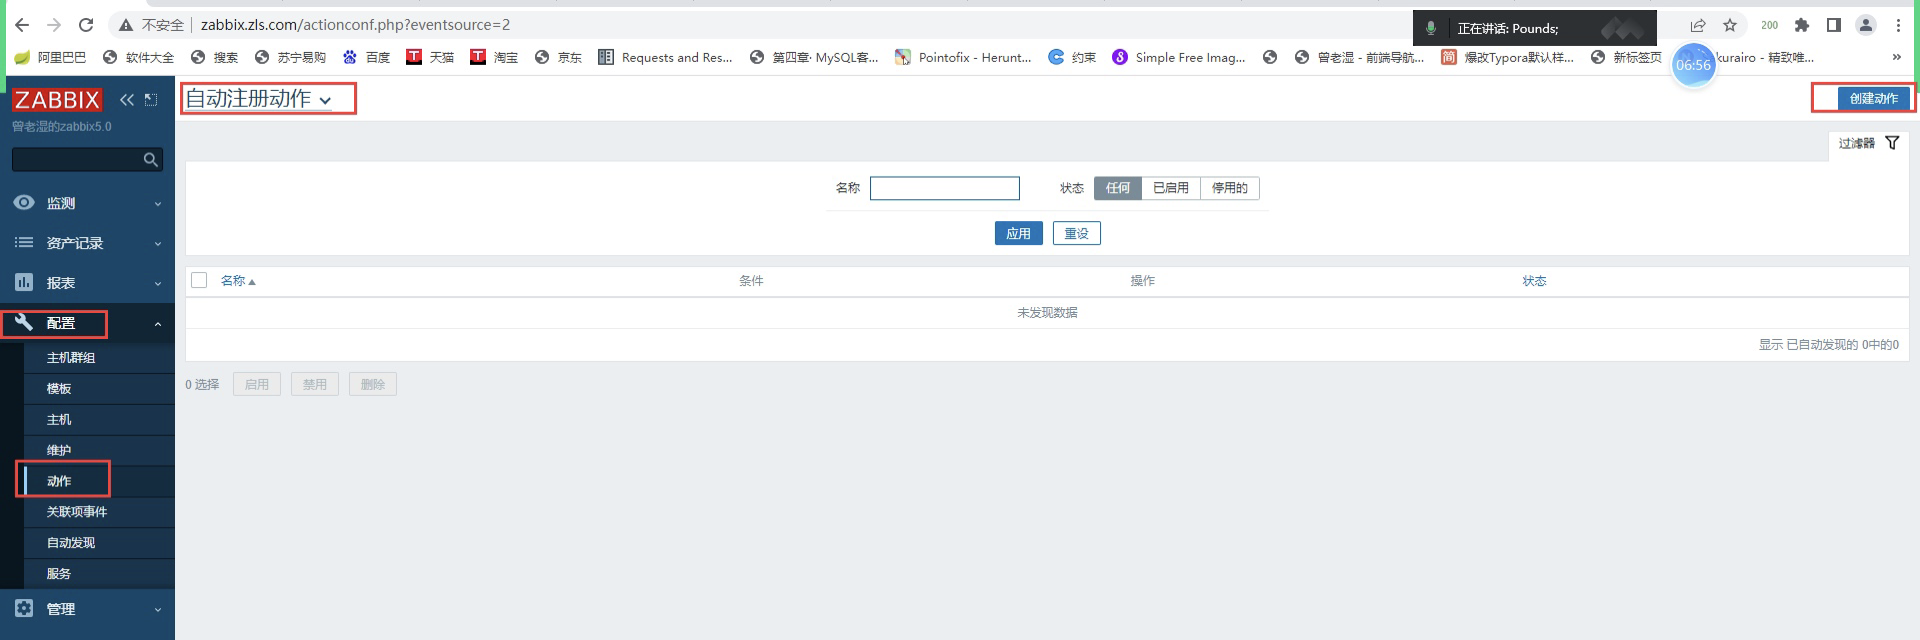
将动作和自动发现关联
1 2 3 4 5 6 7 8 9 10 11 默认标题 自动发现主机IP:{DISCOVERY.DEVICE.IPADDRESS} 消息内容 客户端IP:{DISCOVERY.DEVICE.IPADDRESS} 客户端名称: {DISCOVERY.SERVICE.NAME} 客户端端口: {DISCOVERY.SERVICE.PORT} 客户端状态: {DISCOVERY.SERVICE.STATUS} 操作动作 添加主机,添加主机组,链接模板,发送邮件,等等
zabbix自动发现小结 1 2 3 4 1.网络发现速度太慢 2.轮询扫描网段 3.如果网段中存在不通的主机,会出现卡顿并且造成后续新增的服务器无法加入节点 4.会导致server性能变缓慢,影响server性能
zabbix自动注册(主动) Zabbix agent可以自动注册到服务器进行监控。这种方式无需在服务器上手动配置它们。自动注册官方手册
1 2 3 4 5 6 7 8 [root@web01 ~] Server=172.16.1.61 ServerActive=172.16.1.61 Hostname=web01 Server=172.16.1.61 ServerActive=172.16.1.61 Hostname={{ ansible.fqdn }}
1 2 3 4 Zabbix自动注册 主机名:{HOST.HOST} 主机IP:{HOST.IP} 主机端口:{HOST.PORT}


 将主机关联该模板